
|
Morgan Advanced Materials PLC (MGAM.L) DCF -Bewertung |
Fully Editable: Tailor To Your Needs In Excel Or Sheets
Professional Design: Trusted, Industry-Standard Templates
Investor-Approved Valuation Models
MAC/PC Compatible, Fully Unlocked
No Expertise Is Needed; Easy To Follow
Morgan Advanced Materials plc (MGAM.L) Bundle
Evaluieren Sie wie ein Experte Morgan Advanced Materials PLC (MGAML) finanzielle Aussichten! Dieser (MGAML) DCF-Taschenrechner bietet vorgefüllte Finanzdaten und die Flexibilität, um das Umsatzwachstum, die WACC, die Margen und die anderen wichtigen Annahmen zu ändern, um sich mit Ihren Vorhersagen auszurichten.
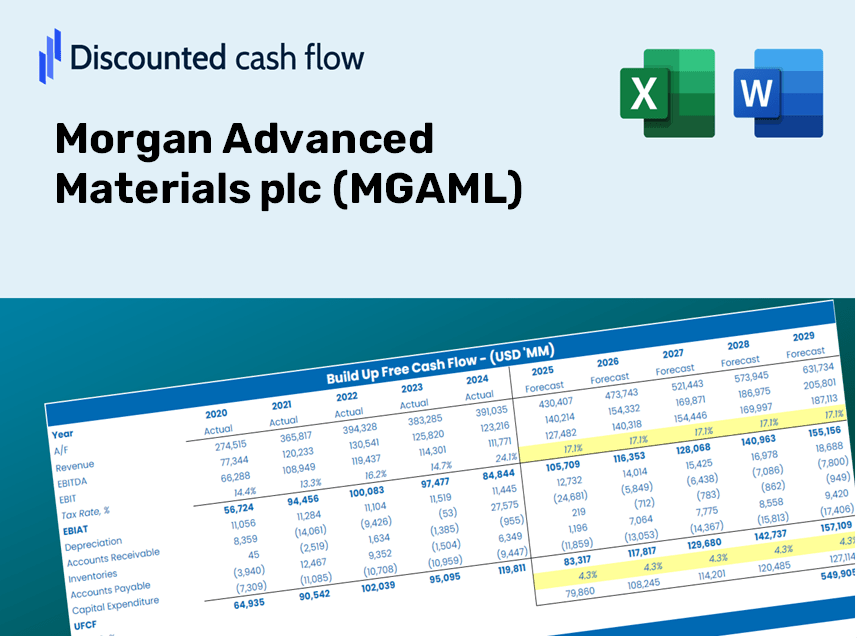
Discounted Cash Flow (DCF) - (USD MM)
| Year | AY1 2020 |
AY2 2021 |
AY3 2022 |
AY4 2023 |
AY5 2024 |
FY1 2025 |
FY2 2026 |
FY3 2027 |
FY4 2028 |
FY5 2029 |
|---|---|---|---|---|---|---|---|---|---|---|
| Revenue | 910.7 | 950.5 | 1,112.1 | 1,114.7 | 1,100.7 | 1,156.7 | 1,215.5 | 1,277.4 | 1,342.4 | 1,410.7 |
| Revenue Growth, % | 0 | 4.37 | 17 | 0.23379 | -1.26 | 5.09 | 5.09 | 5.09 | 5.09 | 5.09 |
| EBITDA | 44.5 | 156.3 | 183.8 | 138.6 | 150.0 | 147.9 | 155.4 | 163.3 | 171.6 | 180.3 |
| EBITDA, % | 4.89 | 16.44 | 16.53 | 12.43 | 13.63 | 12.78 | 12.78 | 12.78 | 12.78 | 12.78 |
| Depreciation | 48.0 | 44.0 | 42.8 | 42.8 | 44.4 | 50.0 | 52.6 | 55.2 | 58.0 | 61.0 |
| Depreciation, % | 5.27 | 4.63 | 3.85 | 3.84 | 4.03 | 4.32 | 4.32 | 4.32 | 4.32 | 4.32 |
| EBIT | -3.5 | 112.3 | 141.0 | 95.8 | 105.6 | 97.9 | 102.8 | 108.1 | 113.6 | 119.3 |
| EBIT, % | -0.38432 | 11.81 | 12.68 | 8.59 | 9.59 | 8.46 | 8.46 | 8.46 | 8.46 | 8.46 |
| Total Cash | 147.8 | 127.3 | 117.7 | 124.5 | 118.6 | 143.8 | 151.1 | 158.8 | 166.9 | 175.3 |
| Total Cash, percent | .0 | .0 | .0 | .0 | .0 | .0 | .0 | .0 | .0 | .0 |
| Account Receivables | 143.6 | 161.4 | 202.5 | 160.3 | 164.8 | 185.8 | 195.2 | 205.2 | 215.6 | 226.6 |
| Account Receivables, % | 15.77 | 16.98 | 18.21 | 14.38 | 14.97 | 16.06 | 16.06 | 16.06 | 16.06 | 16.06 |
| Inventories | 122.4 | 140.7 | 174.2 | 175.1 | 165.9 | 172.8 | 181.6 | 190.8 | 200.5 | 210.7 |
| Inventories, % | 13.44 | 14.8 | 15.66 | 15.71 | 15.07 | 14.94 | 14.94 | 14.94 | 14.94 | 14.94 |
| Accounts Payable | 62.3 | 61.8 | 78.6 | 78.1 | 87.4 | 81.8 | 86.0 | 90.3 | 94.9 | 99.8 |
| Accounts Payable, % | 6.84 | 6.5 | 7.07 | 7.01 | 7.94 | 7.07 | 7.07 | 7.07 | 7.07 | 7.07 |
| Capital Expenditure | -30.0 | -31.6 | -58.0 | -60.4 | -96.1 | -60.1 | -63.2 | -66.4 | -69.8 | -73.3 |
| Capital Expenditure, % | -3.29 | -3.32 | -5.22 | -5.42 | -8.73 | -5.2 | -5.2 | -5.2 | -5.2 | -5.2 |
| Tax Rate, % | 40.54 | 40.54 | 40.54 | 40.54 | 40.54 | 40.54 | 40.54 | 40.54 | 40.54 | 40.54 |
| EBITAT | -6.0 | 79.8 | 94.3 | 58.2 | 62.8 | 70.1 | 73.7 | 77.4 | 81.3 | 85.5 |
| Depreciation | ||||||||||
| Changes in Account Receivables | ||||||||||
| Changes in Inventories | ||||||||||
| Changes in Accounts Payable | ||||||||||
| Capital Expenditure | ||||||||||
| UFCF | -191.7 | 55.6 | 21.3 | 81.4 | 25.1 | 26.5 | 49.0 | 51.5 | 54.1 | 56.8 |
| WACC, % | 7.5 | 6.86 | 6.77 | 6.63 | 6.6 | 6.87 | 6.87 | 6.87 | 6.87 | 6.87 |
| PV UFCF | ||||||||||
| SUM PV UFCF | 192.1 | |||||||||
| Long Term Growth Rate, % | 2.00 | |||||||||
| Free cash flow (T + 1) | 58 | |||||||||
| Terminal Value | 1,190 | |||||||||
| Present Terminal Value | 854 | |||||||||
| Enterprise Value | 1,046 | |||||||||
| Net Debt | 275 | |||||||||
| Equity Value | 771 | |||||||||
| Diluted Shares Outstanding, MM | 287 | |||||||||
| Equity Value Per Share | 268.30 |
What You Will Receive
- Pre-Filled Financial Model: Utilize Morgan Advanced Materials plc's (MGAML) actual data for accurate DCF valuation.
- Comprehensive Forecast Control: Modify revenue growth, profit margins, WACC, and other essential factors.
- Real-Time Calculations: Automatic updates allow you to view results instantly as adjustments are made.
- Professional-Grade Template: An expertly crafted Excel file designed for sophisticated valuation needs.
- Versatile and Reusable: Customizable for flexibility, enabling repeated use for in-depth forecasting.
Key Features
- Accurate Financial Data: Gain access to reliable pre-loaded historical figures and future estimates for Morgan Advanced Materials plc (MGAML).
- Tailorable Forecast Parameters: Modify the highlighted cells, including WACC, growth rates, and profit margins according to your analysis.
- Automated Calculations: Enjoy real-time updates for DCF, Net Present Value (NPV), and cash flow evaluations.
- User-Friendly Dashboard: Intuitive charts and summaries designed to help you easily interpret your valuation outcomes.
- Suitable for All Skill Levels: A straightforward and accessible design tailored for investors, CFOs, and consultants alike.
How It Works
- Download: Obtain the pre-configured Excel file containing Morgan Advanced Materials plc’s (MGAML) financial data.
- Customize: Tailor forecasts by modifying revenue growth, EBITDA percentage, and WACC.
- Update Automatically: Enjoy real-time updates for intrinsic value and NPV calculations.
- Test Scenarios: Generate various projections and instantly compare the results.
- Make Decisions: Utilize the valuation insights to inform your investment strategy.
Why Choose This Calculator for Morgan Advanced Materials plc (MGAML)?
- User-Friendly Interface: Perfect for both novice users and seasoned professionals.
- Customizable Inputs: Effortlessly adjust parameters to suit your specific analysis needs.
- Real-Time Updates: Monitor immediate changes to Morgan Advanced Materials’ valuation as you modify inputs.
- Preloaded Financial Data: Comes with Morgan Advanced Materials’ actual financial figures for swift evaluations.
- Relied Upon by Industry Experts: Favored by investors and analysts for making well-informed choices.
Who Can Benefit from Morgan Advanced Materials plc (MGAML)?
- Investors: Empower your investment choices with a professional-grade valuation tool specific to MGAML.
- Financial Analysts: Enhance efficiency with a customizable DCF model tailored for Morgan Advanced Materials plc (MGAML).
- Consultants: Seamlessly modify the template for impactful client presentations or detailed reports on MGAML.
- Finance Enthusiasts: Expand your knowledge of valuation methods using real-life case studies including Morgan Advanced Materials plc (MGAML).
- Educators and Students: Utilize this resource as a hands-on learning aid in finance courses focused on MGAML and similar companies.
Contents of the Template
- Pre-Filled Data: Features Morgan Advanced Materials plc’s (MGAML) historical financial data and forecasts.
- Discounted Cash Flow Model: An editable DCF valuation model with automatic calculations included.
- Weighted Average Cost of Capital (WACC): A dedicated worksheet for calculating WACC using custom inputs.
- Key Financial Ratios: Evaluate Morgan Advanced Materials plc’s profitability, efficiency, and leverage metrics.
- Customizable Inputs: Easily modify revenue growth, profit margins, and tax rates.
- Clear Dashboard: Visuals and tables that summarize essential valuation outcomes.
Disclaimer
All information, articles, and product details provided on this website are for general informational and educational purposes only. We do not claim any ownership over, nor do we intend to infringe upon, any trademarks, copyrights, logos, brand names, or other intellectual property mentioned or depicted on this site. Such intellectual property remains the property of its respective owners, and any references here are made solely for identification or informational purposes, without implying any affiliation, endorsement, or partnership.
We make no representations or warranties, express or implied, regarding the accuracy, completeness, or suitability of any content or products presented. Nothing on this website should be construed as legal, tax, investment, financial, medical, or other professional advice. In addition, no part of this site—including articles or product references—constitutes a solicitation, recommendation, endorsement, advertisement, or offer to buy or sell any securities, franchises, or other financial instruments, particularly in jurisdictions where such activity would be unlawful.
All content is of a general nature and may not address the specific circumstances of any individual or entity. It is not a substitute for professional advice or services. Any actions you take based on the information provided here are strictly at your own risk. You accept full responsibility for any decisions or outcomes arising from your use of this website and agree to release us from any liability in connection with your use of, or reliance upon, the content or products found herein.