
|
Magic Software Enterprises Ltd. (MGIC) DCF -Bewertung |
Fully Editable: Tailor To Your Needs In Excel Or Sheets
Professional Design: Trusted, Industry-Standard Templates
Investor-Approved Valuation Models
MAC/PC Compatible, Fully Unlocked
No Expertise Is Needed; Easy To Follow
Magic Software Enterprises Ltd. (MGIC) Bundle
Unabhängig davon, ob Sie ein Investor oder Analyst sind, ist dieser DCF -Taschenrechner für Magic Software Enterprises Ltd. (MGIC) Ihr wesentliches Werkzeug für eine genaue Bewertung. Ausgestattet mit echten Daten von Magic Software Enterprises können Sie Prognosen anpassen und die Effekte in Echtzeit beobachten.
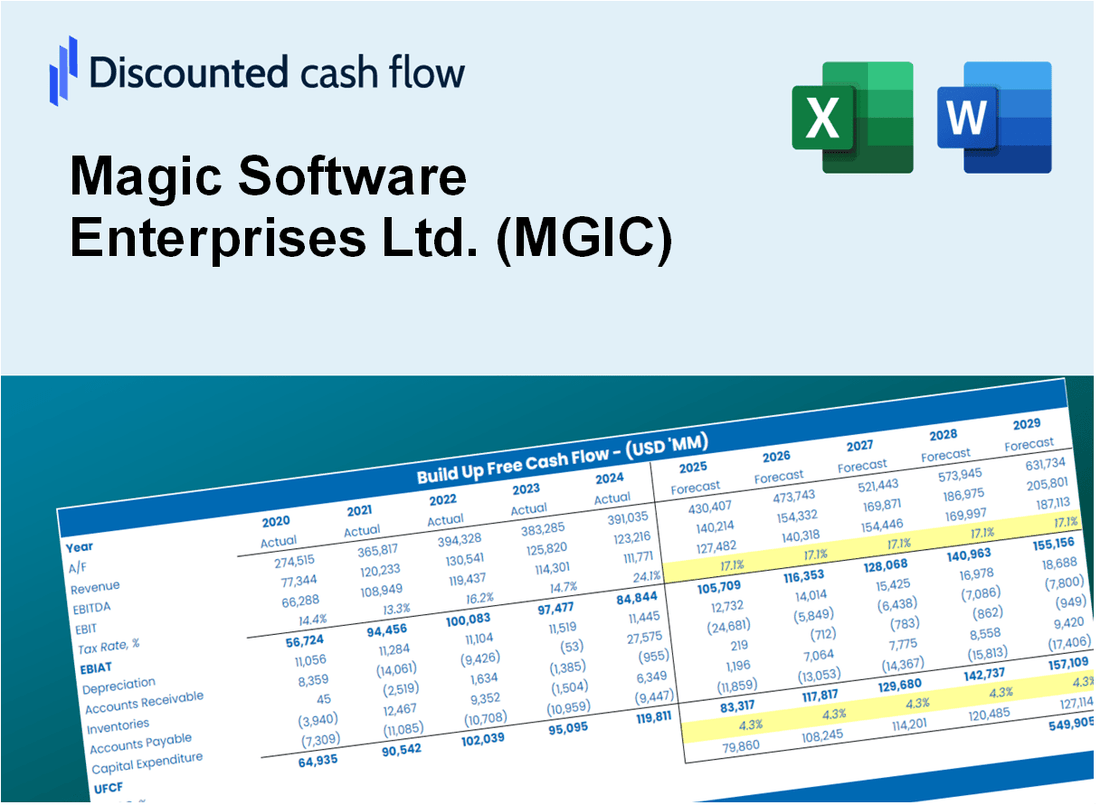
Discounted Cash Flow (DCF) - (USD MM)
| Year | AY1 2020 |
AY2 2021 |
AY3 2022 |
AY4 2023 |
AY5 2024 |
FY1 2025 |
FY2 2026 |
FY3 2027 |
FY4 2028 |
FY5 2029 |
|---|---|---|---|---|---|---|---|---|---|---|
| Revenue | 371.2 | 480.3 | 566.8 | 535.1 | 552.5 | 577.8 | 604.1 | 631.7 | 660.6 | 690.8 |
| Revenue Growth, % | 0 | 29.4 | 18 | -5.6 | 3.26 | 4.57 | 4.57 | 4.57 | 4.57 | 4.57 |
| EBITDA | 55.6 | 74.5 | 82.2 | 82.3 | 82.1 | 86.9 | 90.9 | 95.0 | 99.4 | 103.9 |
| EBITDA, % | 14.98 | 15.5 | 14.5 | 15.38 | 14.85 | 15.04 | 15.04 | 15.04 | 15.04 | 15.04 |
| Depreciation | 13.9 | 19.8 | 19.8 | 20.6 | 20.8 | 21.9 | 22.9 | 24.0 | 25.1 | 26.2 |
| Depreciation, % | 3.76 | 4.13 | 3.49 | 3.84 | 3.77 | 3.8 | 3.8 | 3.8 | 3.8 | 3.8 |
| EBIT | 41.7 | 54.6 | 62.4 | 61.7 | 61.2 | 65.0 | 67.9 | 71.0 | 74.3 | 77.7 |
| EBIT, % | 11.23 | 11.37 | 11.01 | 11.54 | 11.08 | 11.25 | 11.25 | 11.25 | 11.25 | 11.25 |
| Total Cash | 89.7 | 94.8 | 87.0 | 106.7 | 120.4 | 116.7 | 122.0 | 127.6 | 133.4 | 139.5 |
| Total Cash, percent | .0 | .0 | .0 | .0 | .0 | .0 | .0 | .0 | .0 | .0 |
| Account Receivables | 117.4 | 148.5 | 155.2 | 139.6 | 149.8 | 165.4 | 172.9 | 180.8 | 189.1 | 197.7 |
| Account Receivables, % | 31.62 | 30.92 | 27.39 | 26.08 | 27.11 | 28.62 | 28.62 | 28.62 | 28.62 | 28.62 |
| Inventories | -1.2 | .0 | -6.9 | .0 | .0 | -1.8 | -1.9 | -2.0 | -2.1 | -2.1 |
| Inventories, % | -0.33352 | 0 | -1.22 | 0 | 0 | -0.31074 | -0.31074 | -0.31074 | -0.31074 | -0.31074 |
| Accounts Payable | 14.3 | 24.7 | 27.6 | 28.4 | 28.8 | 28.2 | 29.4 | 30.8 | 32.2 | 33.7 |
| Accounts Payable, % | 3.84 | 5.14 | 4.87 | 5.31 | 5.2 | 4.87 | 4.87 | 4.87 | 4.87 | 4.87 |
| Capital Expenditure | -6.1 | -4.6 | -7.7 | -4.8 | -1.5 | -5.9 | -6.2 | -6.5 | -6.8 | -7.1 |
| Capital Expenditure, % | -1.64 | -0.96435 | -1.35 | -0.8973 | -0.27782 | -1.03 | -1.03 | -1.03 | -1.03 | -1.03 |
| Tax Rate, % | 32.47 | 32.47 | 32.47 | 32.47 | 32.47 | 32.47 | 32.47 | 32.47 | 32.47 | 32.47 |
| EBITAT | 28.1 | 35.9 | 43.8 | 43.6 | 41.4 | 44.4 | 46.4 | 48.5 | 50.7 | 53.0 |
| Depreciation | ||||||||||
| Changes in Account Receivables | ||||||||||
| Changes in Inventories | ||||||||||
| Changes in Accounts Payable | ||||||||||
| Capital Expenditure | ||||||||||
| UFCF | -66.0 | 29.2 | 59.0 | 68.9 | 50.8 | 46.0 | 56.9 | 59.6 | 62.3 | 65.1 |
| WACC, % | 7.09 | 7.08 | 7.1 | 7.1 | 7.09 | 7.09 | 7.09 | 7.09 | 7.09 | 7.09 |
| PV UFCF | ||||||||||
| SUM PV UFCF | 234.7 | |||||||||
| Long Term Growth Rate, % | 2.00 | |||||||||
| Free cash flow (T + 1) | 66 | |||||||||
| Terminal Value | 1,305 | |||||||||
| Present Terminal Value | 926 | |||||||||
| Enterprise Value | 1,161 | |||||||||
| Net Debt | -27 | |||||||||
| Equity Value | 1,188 | |||||||||
| Diluted Shares Outstanding, MM | 49 | |||||||||
| Equity Value Per Share | 24.19 |
What You Will Receive
- Pre-Filled Financial Model: Magic Software Enterprises Ltd.'s (MGIC) actual data allows for accurate DCF valuation.
- Comprehensive Forecast Control: Modify revenue growth, profit margins, WACC, and other essential factors.
- Real-Time Calculations: Automatic updates provide immediate feedback as you adjust inputs.
- Professional-Grade Template: A polished Excel file crafted for serious valuation analysis.
- Flexible and Reusable: Designed for adaptability, enabling repeated use for in-depth forecasts.
Key Features
- Comprehensive Financial Data: Gain access to precise pre-loaded historical figures and future forecasts for Magic Software Enterprises Ltd. (MGIC).
- Flexible Projection Inputs: Modify highlighted cells for key variables such as WACC, growth rates, and profit margins.
- Real-Time Calculations: Automatic adjustments for DCF, Net Present Value (NPV), and cash flow assessments.
- User-Friendly Dashboard: Intuitive charts and summaries that make it easy to interpret your valuation outcomes.
- Designed for All Skill Levels: An accessible layout tailored for investors, CFOs, and consultants alike.
How It Works
- Step 1: Download the Excel file.
- Step 2: Review Magic Software Enterprises Ltd.'s (MGIC) pre-filled financial data and forecasts.
- Step 3: Modify essential inputs such as revenue growth, WACC, and tax rates (highlighted cells).
- Step 4: Observe the DCF model update in real-time as you adjust your assumptions.
- Step 5: Analyze the outputs and leverage the results for your investment strategies.
Why Choose This Calculator for Magic Software Enterprises Ltd. (MGIC)?
- User-Friendly Interface: Suitable for both novices and seasoned professionals.
- Customizable Inputs: Modify variables easily to tailor your analysis.
- Real-Time Valuation: Observe immediate updates to MGIC’s valuation as you change inputs.
- Preloaded Data: Comes with Magic Software's actual financial metrics for swift evaluations.
- Preferred by Experts: Utilized by investors and analysts for making well-informed choices.
Who Should Use This Product?
- Individual Investors: Gain insights for making informed decisions about buying or selling Magic Software Enterprises Ltd. (MGIC) stock.
- Financial Analysts: Enhance valuation processes with comprehensive financial models tailored for Magic Software Enterprises Ltd. (MGIC).
- Consultants: Provide clients with accurate and timely valuation assessments of Magic Software Enterprises Ltd. (MGIC).
- Business Owners: Learn how companies like Magic Software Enterprises Ltd. (MGIC) are valued to inform your business strategies.
- Finance Students: Acquire practical knowledge of valuation techniques using data and case studies from Magic Software Enterprises Ltd. (MGIC).
What the Template Contains
- Pre-Filled Data: Includes Magic Software Enterprises Ltd.'s historical financials and forecasts.
- Discounted Cash Flow Model: Editable DCF valuation model with automatic calculations.
- Weighted Average Cost of Capital (WACC): A dedicated sheet for calculating WACC based on custom inputs.
- Key Financial Ratios: Analyze Magic Software Enterprises Ltd.'s profitability, efficiency, and leverage.
- Customizable Inputs: Edit revenue growth, margins, and tax rates with ease.
- Clear Dashboard: Charts and tables summarizing key valuation results.
Disclaimer
All information, articles, and product details provided on this website are for general informational and educational purposes only. We do not claim any ownership over, nor do we intend to infringe upon, any trademarks, copyrights, logos, brand names, or other intellectual property mentioned or depicted on this site. Such intellectual property remains the property of its respective owners, and any references here are made solely for identification or informational purposes, without implying any affiliation, endorsement, or partnership.
We make no representations or warranties, express or implied, regarding the accuracy, completeness, or suitability of any content or products presented. Nothing on this website should be construed as legal, tax, investment, financial, medical, or other professional advice. In addition, no part of this site—including articles or product references—constitutes a solicitation, recommendation, endorsement, advertisement, or offer to buy or sell any securities, franchises, or other financial instruments, particularly in jurisdictions where such activity would be unlawful.
All content is of a general nature and may not address the specific circumstances of any individual or entity. It is not a substitute for professional advice or services. Any actions you take based on the information provided here are strictly at your own risk. You accept full responsibility for any decisions or outcomes arising from your use of this website and agree to release us from any liability in connection with your use of, or reliance upon, the content or products found herein.