
|
MoneyLion Inc. WT (ML-WT) DCF-Bewertung |
Fully Editable: Tailor To Your Needs In Excel Or Sheets
Professional Design: Trusted, Industry-Standard Templates
Investor-Approved Valuation Models
MAC/PC Compatible, Fully Unlocked
No Expertise Is Needed; Easy To Follow
MoneyLion Inc. WT (ML-WT) Bundle
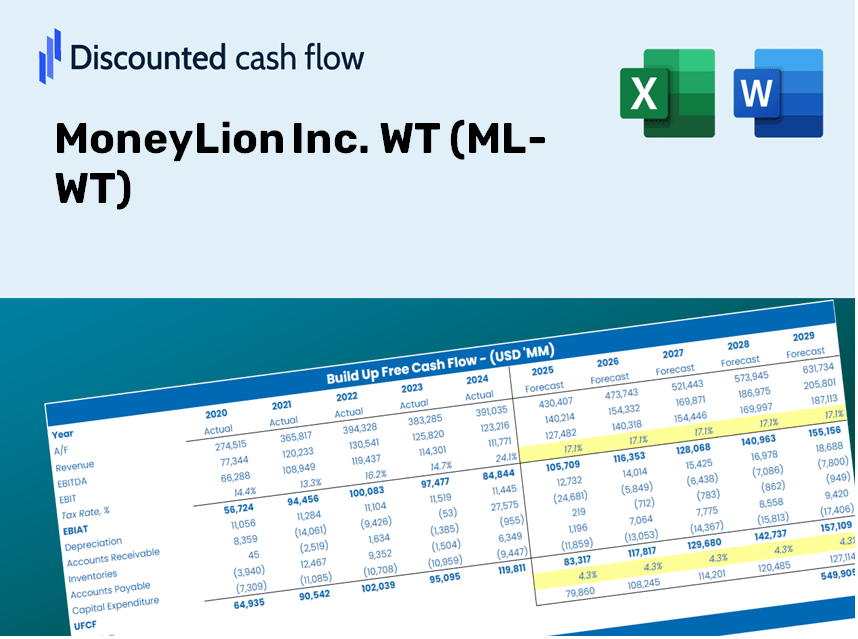
Vereinfachen Sie die Bewertung der MoneyLion Inc. WT (ML-WT) mit diesem anpassbaren DCF-Taschenrechner! Mit Real MoneyLion Inc. WT (ML-WT) -Fonds und einstellbaren Prognoseeingaben können Sie Szenarien testen und MoneyLion Inc. WT (ML-WT) Fair-Wert in Minuten aufdecken.
Discounted Cash Flow (DCF) - (USD MM)
| Year | AY1 2020 |
AY2 2021 |
AY3 2022 |
AY4 2023 |
AY5 2024 |
FY1 2025 |
FY2 2026 |
FY3 2027 |
FY4 2028 |
FY5 2029 |
|---|---|---|---|---|---|---|---|---|---|---|
| Revenue | 79.4 | 171.1 | 340.7 | 423.4 | 545.9 | 890.3 | 1,451.9 | 2,367.7 | 3,861.4 | 6,297.2 |
| Revenue Growth, % | 0 | 115.48 | 99.14 | 24.27 | 28.92 | 63.08 | 63.08 | 63.08 | 63.08 | 63.08 |
| EBITDA | -37.5 | -159.8 | -163.2 | 7.2 | 59.4 | -313.3 | -510.9 | -833.3 | -1,358.9 | -2,216.1 |
| EBITDA, % | -47.25 | -93.38 | -47.9 | 1.69 | 10.88 | -35.19 | -35.19 | -35.19 | -35.19 | -35.19 |
| Depreciation | 1.1 | 2.4 | 21.7 | 24.8 | 25.7 | 35.1 | 57.3 | 93.4 | 152.3 | 248.3 |
| Depreciation, % | 1.4 | 1.4 | 6.36 | 5.86 | 4.7 | 3.94 | 3.94 | 3.94 | 3.94 | 3.94 |
| EBIT | -38.6 | -162.2 | -184.9 | -17.7 | 33.7 | -348.4 | -568.2 | -926.6 | -1,511.2 | -2,464.4 |
| EBIT, % | -48.65 | -94.78 | -54.26 | -4.17 | 6.18 | -39.14 | -39.14 | -39.14 | -39.14 | -39.14 |
| Total Cash | 19.4 | 201.8 | 115.9 | 92.2 | 140.0 | 366.5 | 597.7 | 974.8 | 1,589.8 | 2,592.6 |
| Total Cash, percent | .0 | .0 | .0 | .0 | .0 | .0 | .0 | .0 | .0 | .0 |
| Account Receivables | 67.2 | 155.1 | 196.7 | 226.1 | 116.6 | 547.9 | 893.6 | 1,457.3 | 2,376.5 | 3,875.7 |
| Account Receivables, % | 84.63 | 90.62 | 57.73 | 53.4 | 21.36 | 61.55 | 61.55 | 61.55 | 61.55 | 61.55 |
| Inventories | .0 | 35.6 | .0 | .0 | .0 | 37.1 | 60.5 | 98.6 | 160.8 | 262.2 |
| Inventories, % | 0.000001259271 | 20.82 | 0.000000293 | 0 | 0 | 4.16 | 4.16 | 4.16 | 4.16 | 4.16 |
| Accounts Payable | 21.0 | 36.9 | 58.1 | 52.4 | .0 | 137.8 | 224.7 | 366.5 | 597.6 | 974.6 |
| Accounts Payable, % | 26.4 | 21.55 | 17.06 | 12.37 | 0 | 15.48 | 15.48 | 15.48 | 15.48 | 15.48 |
| Capital Expenditure | -1.2 | -.5 | -8.9 | -6.0 | -9.2 | -13.3 | -21.7 | -35.4 | -57.8 | -94.2 |
| Capital Expenditure, % | -1.49 | -0.27994 | -2.61 | -1.42 | -1.68 | -1.5 | -1.5 | -1.5 | -1.5 | -1.5 |
| Tax Rate, % | 65.68 | 65.68 | 65.68 | 65.68 | 65.68 | 65.68 | 65.68 | 65.68 | 65.68 | 65.68 |
| EBITAT | -38.6 | -162.2 | -163.9 | -17.2 | 11.6 | -293.1 | -478.0 | -779.5 | -1,271.3 | -2,073.2 |
| Depreciation | ||||||||||
| Changes in Account Receivables | ||||||||||
| Changes in Inventories | ||||||||||
| Changes in Accounts Payable | ||||||||||
| Capital Expenditure | ||||||||||
| UFCF | -84.9 | -267.9 | -135.9 | -33.6 | 85.2 | -601.9 | -724.6 | -1,181.7 | -1,927.1 | -3,142.7 |
| WACC, % | 18.06 | 18.06 | 18.03 | 18.05 | 17.91 | 18.02 | 18.02 | 18.02 | 18.02 | 18.02 |
| PV UFCF | ||||||||||
| SUM PV UFCF | -4,114.6 | |||||||||
| Long Term Growth Rate, % | 2.00 | |||||||||
| Free cash flow (T + 1) | -3,206 | |||||||||
| Terminal Value | -20,007 | |||||||||
| Present Terminal Value | -8,737 | |||||||||
| Enterprise Value | -12,852 | |||||||||
| Net Debt | -21 | |||||||||
| Equity Value | -12,830 | |||||||||
| Diluted Shares Outstanding, MM | 120 | |||||||||
| Equity Value Per Share | -106.79 |
What You Will Receive
- Pre-Filled Financial Model: MoneyLion's actual data allows for accurate DCF valuation.
- Comprehensive Forecast Control: Tailor revenue growth, margins, WACC, and other pivotal factors.
- Real-Time Calculations: Automatic updates provide immediate results as adjustments are made.
- Investor-Ready Template: A polished Excel file crafted for high-quality valuation.
- Customizable and Reusable: Designed for adaptability, enabling multiple uses for in-depth forecasts.
Key Features
- Customizable Financial Metrics: Adjust essential factors such as revenue growth, EBITDA %, and capital investments.
- Instant DCF Valuation: Provides quick calculations for intrinsic value, NPV, and other key outputs.
- High-Precision Accuracy: Leverages MoneyLion Inc.'s real-world financial data for credible valuation results.
- Simplified Scenario Analysis: Effortlessly evaluate various assumptions and analyze the resulting impacts.
- Efficiency Booster: Streamlines the valuation process by removing the need for intricate model creation from the ground up.
How It Functions
- Download the Template: Gain immediate access to the Excel-based MoneyLion Inc. WT (ML-WT) DCF Calculator.
- Input Your Assumptions: Modify the yellow-highlighted cells to reflect your growth rates, WACC, margins, and other key factors.
- Instant Calculations: The model automatically recalculates MoneyLion’s intrinsic value.
- Test Scenarios: Experiment with various assumptions to assess potential shifts in valuation.
- Analyze and Decide: Leverage the findings to inform your investment or financial strategy.
Why Opt for MoneyLion Inc. WT (ML-WT) Calculator?
- Precision: Leveraging real MoneyLion financials ensures top-notch data accuracy.
- Adaptability: Crafted for users to easily experiment and adjust inputs as needed.
- Efficiency: Eliminate the tedious process of creating a financial model from the ground up.
- Expert-Quality: Designed with the meticulous standards of CFO-level expertise in mind.
- Intuitive: Simple to navigate, even for those without extensive financial modeling skills.
Who Should Benefit from MoneyLion Inc. WT (ML-WT)?
- Investors: Evaluate MoneyLion's valuation prior to making investment decisions.
- CFOs and Financial Analysts: Optimize valuation workflows and assess future projections.
- Startup Founders: Discover how large public companies like MoneyLion are appraised.
- Consultants: Create detailed valuation reports for your clients featuring MoneyLion.
- Students and Educators: Apply real-world examples to hone and teach valuation strategies.
Overview of the Template Features
- Pre-Filled DCF Model: MoneyLion Inc.'s (ML-WT) financial data preloaded for immediate use.
- WACC Calculator: Comprehensive calculations for Weighted Average Cost of Capital.
- Financial Ratios: Analyze MoneyLion's (ML-WT) profitability, leverage, and operational efficiency.
- Editable Inputs: Adjust assumptions such as growth rates, margins, and CAPEX to match your scenarios.
- Financial Statements: Annual and quarterly reports available for thorough analysis.
- Interactive Dashboard: Easily visualize key valuation metrics and outcomes.
Disclaimer
All information, articles, and product details provided on this website are for general informational and educational purposes only. We do not claim any ownership over, nor do we intend to infringe upon, any trademarks, copyrights, logos, brand names, or other intellectual property mentioned or depicted on this site. Such intellectual property remains the property of its respective owners, and any references here are made solely for identification or informational purposes, without implying any affiliation, endorsement, or partnership.
We make no representations or warranties, express or implied, regarding the accuracy, completeness, or suitability of any content or products presented. Nothing on this website should be construed as legal, tax, investment, financial, medical, or other professional advice. In addition, no part of this site—including articles or product references—constitutes a solicitation, recommendation, endorsement, advertisement, or offer to buy or sell any securities, franchises, or other financial instruments, particularly in jurisdictions where such activity would be unlawful.
All content is of a general nature and may not address the specific circumstances of any individual or entity. It is not a substitute for professional advice or services. Any actions you take based on the information provided here are strictly at your own risk. You accept full responsibility for any decisions or outcomes arising from your use of this website and agree to release us from any liability in connection with your use of, or reliance upon, the content or products found herein.