
|
Mesa Laboratories, Inc. (MLAB) DCF -Bewertung |
Fully Editable: Tailor To Your Needs In Excel Or Sheets
Professional Design: Trusted, Industry-Standard Templates
Investor-Approved Valuation Models
MAC/PC Compatible, Fully Unlocked
No Expertise Is Needed; Easy To Follow
Mesa Laboratories, Inc. (MLAB) Bundle
Unabhängig davon, ob Sie ein Investor oder Analyst sind, ist dieser (MLAB) DCF-Taschenrechner Ihr Anlaufwerk für eine genaue Bewertung. Mit realen Daten von Mesa Laboratories, Inc. geladen, können Sie Prognosen anpassen und die Auswirkungen sofort beobachten.
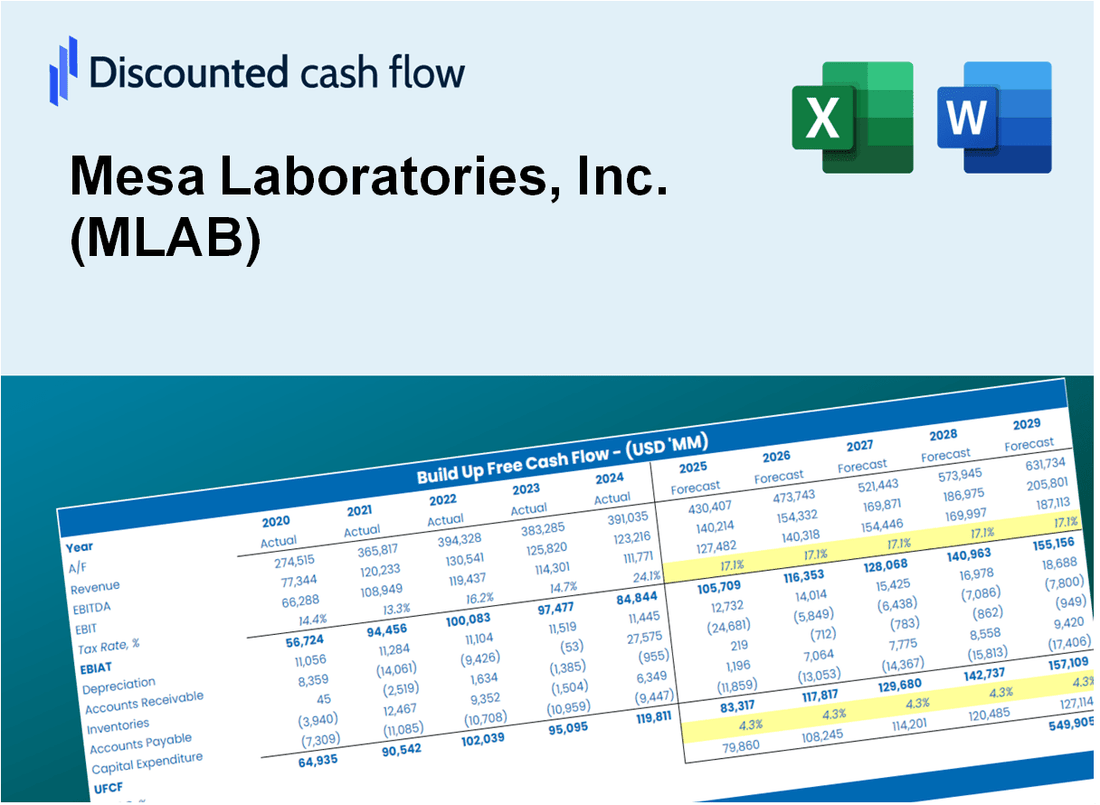
Discounted Cash Flow (DCF) - (USD MM)
| Year | AY1 2021 |
AY2 2022 |
AY3 2023 |
AY4 2024 |
AY5 2025 |
FY1 2026 |
FY2 2027 |
FY3 2028 |
FY4 2029 |
FY5 2030 |
|---|---|---|---|---|---|---|---|---|---|---|
| Revenue | 133.9 | 184.3 | 219.1 | 216.2 | 241.0 | 249.1 | 257.6 | 266.3 | 275.3 | 284.7 |
| Revenue Growth, % | 0 | 37.63 | 18.85 | -1.32 | 11.47 | 3.39 | 3.39 | 3.39 | 3.39 | 3.39 |
| EBITDA | 28.0 | 32.5 | 37.5 | -238.4 | 42.3 | -13.3 | -13.8 | -14.3 | -14.7 | -15.2 |
| EBITDA, % | 20.9 | 17.65 | 17.12 | -110.26 | 17.57 | -5.35 | -5.35 | -5.35 | -5.35 | -5.35 |
| Depreciation | 17.7 | 25.1 | 33.1 | 31.6 | 24.5 | 33.2 | 34.4 | 35.5 | 36.7 | 38.0 |
| Depreciation, % | 13.19 | 13.6 | 15.12 | 14.6 | 10.18 | 13.34 | 13.34 | 13.34 | 13.34 | 13.34 |
| EBIT | 10.3 | 7.5 | 4.4 | -270.0 | 17.8 | -39.3 | -40.6 | -42.0 | -43.4 | -44.9 |
| EBIT, % | 7.71 | 4.05 | 2 | -124.87 | 7.39 | -15.77 | -15.77 | -15.77 | -15.77 | -15.77 |
| Total Cash | 263.9 | 49.3 | 32.9 | 28.2 | 27.3 | 82.8 | 85.6 | 88.5 | 91.5 | 94.6 |
| Total Cash, percent | .0 | .0 | .0 | .0 | .0 | .0 | .0 | .0 | .0 | .0 |
| Account Receivables | 23.8 | 41.2 | 42.6 | 39.1 | 42.0 | 47.4 | 49.0 | 50.6 | 52.3 | 54.1 |
| Account Receivables, % | 17.76 | 22.36 | 19.42 | 18.07 | 17.42 | 19.01 | 19.01 | 19.01 | 19.01 | 19.01 |
| Inventories | 11.2 | 24.6 | 34.6 | 32.7 | 25.4 | 31.5 | 32.5 | 33.6 | 34.8 | 36.0 |
| Inventories, % | 8.35 | 13.35 | 15.81 | 15.11 | 10.53 | 12.63 | 12.63 | 12.63 | 12.63 | 12.63 |
| Accounts Payable | 4.5 | 7.9 | 6.1 | 6.0 | 5.7 | 7.8 | 8.0 | 8.3 | 8.6 | 8.9 |
| Accounts Payable, % | 3.34 | 4.28 | 2.8 | 2.79 | 2.38 | 3.12 | 3.12 | 3.12 | 3.12 | 3.12 |
| Capital Expenditure | -2.0 | -4.4 | -4.5 | -2.6 | -4.5 | -4.5 | -4.6 | -4.8 | -5.0 | -5.1 |
| Capital Expenditure, % | -1.49 | -2.4 | -2.07 | -1.19 | -1.87 | -1.8 | -1.8 | -1.8 | -1.8 | -1.8 |
| Tax Rate, % | 133.12 | 133.12 | 133.12 | 133.12 | 133.12 | 133.12 | 133.12 | 133.12 | 133.12 | 133.12 |
| EBITAT | 14.7 | 3.9 | -10.5 | -249.0 | -5.9 | -19.2 | -19.9 | -20.5 | -21.2 | -22.0 |
| Depreciation | ||||||||||
| Changes in Account Receivables | ||||||||||
| Changes in Inventories | ||||||||||
| Changes in Accounts Payable | ||||||||||
| Capital Expenditure | ||||||||||
| UFCF | -.1 | -2.9 | 5.0 | -214.6 | 18.2 | .1 | 7.4 | 7.7 | 7.9 | 8.2 |
| WACC, % | 7.58 | 6.61 | 5.54 | 7.42 | 5.54 | 6.54 | 6.54 | 6.54 | 6.54 | 6.54 |
| PV UFCF | ||||||||||
| SUM PV UFCF | 25.1 | |||||||||
| Long Term Growth Rate, % | 4.00 | |||||||||
| Free cash flow (T + 1) | 9 | |||||||||
| Terminal Value | 337 | |||||||||
| Present Terminal Value | 245 | |||||||||
| Enterprise Value | 270 | |||||||||
| Net Debt | 154 | |||||||||
| Equity Value | 116 | |||||||||
| Diluted Shares Outstanding, MM | 5 | |||||||||
| Equity Value Per Share | 21.39 |
What You Will Get
- Pre-Filled Financial Model: Mesa Laboratories, Inc.'s (MLAB) actual data facilitates accurate DCF valuation.
- Full Forecast Control: Modify revenue growth, margins, WACC, and other essential drivers.
- Instant Calculations: Automatic updates provide immediate feedback as you adjust parameters.
- Investor-Ready Template: A polished Excel file crafted for professional-level valuation.
- Customizable and Reusable: Designed for versatility, allowing repeated application for in-depth forecasts.
Key Features
- Comprehensive Historical Data: Mesa Laboratories, Inc. (MLAB) provides access to extensive historical financial statements and pre-populated forecasts.
- Customizable Parameters: Adjust WACC, tax rates, revenue growth, and EBITDA margins to fit your analysis.
- Real-Time Valuation: Instantly view the recalculated intrinsic value of Mesa Laboratories, Inc. (MLAB).
- Intuitive Visualizations: Dashboard charts present valuation outcomes and essential metrics clearly.
- Designed for Precision: A robust tool tailored for analysts, investors, and finance professionals.
How It Works
- 1. Access the Template: Download and open the Excel file featuring Mesa Laboratories, Inc. (MLAB) preloaded data.
- 2. Adjust Assumptions: Modify key parameters such as growth rates, WACC, and capital expenditures.
- 3. View Results Instantly: The DCF model automatically calculates intrinsic value and NPV based on your inputs.
- 4. Explore Scenarios: Analyze various forecasts to evaluate different valuation scenarios.
- 5. Present with Assurance: Share professional valuation insights to bolster your decision-making process.
Why Choose This Calculator for Mesa Laboratories, Inc. (MLAB)?
- Designed for Experts: A sophisticated tool tailored for analysts, CFOs, and industry consultants.
- Accurate Financial Data: Mesa Laboratories' historical and projected financials are preloaded for precision.
- Flexible Scenario Analysis: Effortlessly test various forecasts and assumptions.
- Comprehensive Outputs: Automatically calculates intrinsic value, NPV, and essential metrics.
- User-Friendly Interface: Step-by-step guidance ensures a smooth experience.
Who Should Use This Product?
- Investors: Accurately estimate Mesa Laboratories, Inc.'s (MLAB) fair value before making investment decisions.
- CFOs: Utilize a professional-grade DCF model for financial reporting and analysis specific to Mesa Laboratories, Inc. (MLAB).
- Consultants: Efficiently customize the template for valuation reports tailored to Mesa Laboratories, Inc. (MLAB) clients.
- Entrepreneurs: Acquire insights into financial modeling practices employed by successful companies like Mesa Laboratories, Inc. (MLAB).
- Educators: Implement it as a teaching resource to illustrate valuation methodologies using Mesa Laboratories, Inc. (MLAB) as a case study.
What the Template Contains
- Pre-Filled Data: Includes Mesa Laboratories, Inc. (MLAB)'s historical financials and forecasts.
- Discounted Cash Flow Model: Editable DCF valuation model with automatic calculations.
- Weighted Average Cost of Capital (WACC): A dedicated sheet for calculating WACC based on custom inputs.
- Key Financial Ratios: Analyze Mesa Laboratories, Inc. (MLAB)'s profitability, efficiency, and leverage.
- Customizable Inputs: Edit revenue growth, margins, and tax rates with ease.
- Clear Dashboard: Charts and tables summarizing key valuation results.
Disclaimer
All information, articles, and product details provided on this website are for general informational and educational purposes only. We do not claim any ownership over, nor do we intend to infringe upon, any trademarks, copyrights, logos, brand names, or other intellectual property mentioned or depicted on this site. Such intellectual property remains the property of its respective owners, and any references here are made solely for identification or informational purposes, without implying any affiliation, endorsement, or partnership.
We make no representations or warranties, express or implied, regarding the accuracy, completeness, or suitability of any content or products presented. Nothing on this website should be construed as legal, tax, investment, financial, medical, or other professional advice. In addition, no part of this site—including articles or product references—constitutes a solicitation, recommendation, endorsement, advertisement, or offer to buy or sell any securities, franchises, or other financial instruments, particularly in jurisdictions where such activity would be unlawful.
All content is of a general nature and may not address the specific circumstances of any individual or entity. It is not a substitute for professional advice or services. Any actions you take based on the information provided here are strictly at your own risk. You accept full responsibility for any decisions or outcomes arising from your use of this website and agree to release us from any liability in connection with your use of, or reliance upon, the content or products found herein.