
|
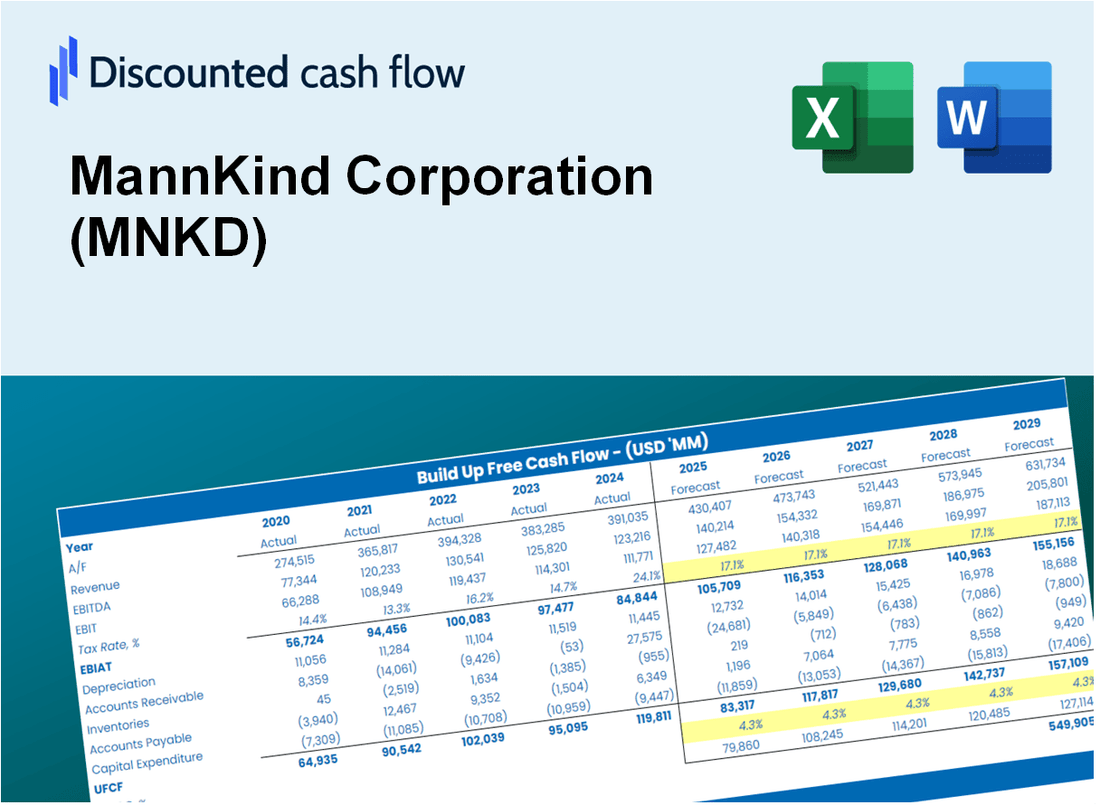
DCF -Bewertung der Mannkind Corporation (MNKD) |
Fully Editable: Tailor To Your Needs In Excel Or Sheets
Professional Design: Trusted, Industry-Standard Templates
Investor-Approved Valuation Models
MAC/PC Compatible, Fully Unlocked
No Expertise Is Needed; Easy To Follow
MannKind Corporation (MNKD) Bundle
Unser MNKD DCF-Taschenrechner entwickelt für die Genauigkeit und ermöglicht es Ihnen, die Bewertung der Mannkind Corporation mithilfe realer Finanzdaten zu bewerten und vollständige Flexibilität zu bieten, um alle wesentlichen Parameter für verbesserte Projektionen zu ändern.
Discounted Cash Flow (DCF) - (USD MM)
| Year | AY1 2020 |
AY2 2021 |
AY3 2022 |
AY4 2023 |
AY5 2024 |
FY1 2025 |
FY2 2026 |
FY3 2027 |
FY4 2028 |
FY5 2029 |
|---|---|---|---|---|---|---|---|---|---|---|
| Revenue | 65.1 | 75.4 | 99.8 | 199.0 | 285.5 | 421.8 | 623.2 | 920.7 | 1,360.3 | 2,009.8 |
| Revenue Growth, % | 0 | 15.81 | 32.25 | 99.42 | 43.5 | 47.74 | 47.74 | 47.74 | 47.74 | 47.74 |
| EBITDA | -44.7 | -61.1 | -56.3 | 15.1 | 77.5 | -144.5 | -213.5 | -315.4 | -466.0 | -688.4 |
| EBITDA, % | -68.56 | -81 | -56.45 | 7.6 | 27.13 | -34.25 | -34.25 | -34.25 | -34.25 | -34.25 |
| Depreciation | 3.3 | 3.2 | 6.3 | 4.5 | 9.0 | 17.8 | 26.4 | 39.0 | 57.5 | 85.0 |
| Depreciation, % | 5.11 | 4.3 | 6.33 | 2.28 | 3.14 | 4.23 | 4.23 | 4.23 | 4.23 | 4.23 |
| EBIT | -48.0 | -64.3 | -62.6 | 10.6 | 68.5 | -162.3 | -239.8 | -354.3 | -523.5 | -773.4 |
| EBIT, % | -73.66 | -85.3 | -62.78 | 5.32 | 23.99 | -38.48 | -38.48 | -38.48 | -38.48 | -38.48 |
| Total Cash | 67.0 | 204.1 | 170.8 | 295.1 | 197.3 | 395.7 | 584.7 | 863.8 | 1,276.2 | 1,885.5 |
| Total Cash, percent | .0 | .0 | .0 | .0 | .0 | .0 | .0 | .0 | .0 | .0 |
| Account Receivables | 4.2 | 4.7 | 16.8 | 14.9 | 11.8 | 34.8 | 51.4 | 75.9 | 112.1 | 165.7 |
| Account Receivables, % | 6.47 | 6.28 | 16.84 | 7.49 | 4.13 | 8.24 | 8.24 | 8.24 | 8.24 | 8.24 |
| Inventories | 5.0 | 7.2 | 21.8 | 28.5 | 27.9 | 53.2 | 78.6 | 116.1 | 171.5 | 253.4 |
| Inventories, % | 7.63 | 9.48 | 21.82 | 14.35 | 9.77 | 12.61 | 12.61 | 12.61 | 12.61 | 12.61 |
| Accounts Payable | 5.6 | 7.0 | 11.1 | 9.6 | 6.8 | 30.4 | 44.9 | 66.4 | 98.1 | 144.9 |
| Accounts Payable, % | 8.57 | 9.22 | 11.08 | 4.81 | 2.38 | 7.21 | 7.21 | 7.21 | 7.21 | 7.21 |
| Capital Expenditure | -4.8 | -11.5 | -7.6 | -42.4 | -9.7 | -46.3 | -68.4 | -101.1 | -149.3 | -220.6 |
| Capital Expenditure, % | -7.34 | -15.2 | -7.61 | -21.33 | -3.4 | -10.97 | -10.97 | -10.97 | -10.97 | -10.97 |
| Tax Rate, % | 9.6 | 9.6 | 9.6 | 9.6 | 9.6 | 9.6 | 9.6 | 9.6 | 9.6 | 9.6 |
| EBITAT | -47.8 | -64.3 | -62.6 | 12.2 | 61.9 | -159.1 | -235.0 | -347.3 | -513.1 | -758.0 |
| Depreciation | ||||||||||
| Changes in Account Receivables | ||||||||||
| Changes in Inventories | ||||||||||
| Changes in Accounts Payable | ||||||||||
| Capital Expenditure | ||||||||||
| UFCF | -52.9 | -73.9 | -86.5 | -32.1 | 62.2 | -212.2 | -304.5 | -449.9 | -664.8 | -982.1 |
| WACC, % | 9.87 | 9.88 | 9.88 | 9.88 | 9.64 | 9.83 | 9.83 | 9.83 | 9.83 | 9.83 |
| PV UFCF | ||||||||||
| SUM PV UFCF | -1,856.5 | |||||||||
| Long Term Growth Rate, % | 2.00 | |||||||||
| Free cash flow (T + 1) | -1,002 | |||||||||
| Terminal Value | -12,789 | |||||||||
| Present Terminal Value | -8,002 | |||||||||
| Enterprise Value | -9,858 | |||||||||
| Net Debt | 1 | |||||||||
| Equity Value | -9,860 | |||||||||
| Diluted Shares Outstanding, MM | 284 | |||||||||
| Equity Value Per Share | -34.74 |
What You Will Receive
- Pre-Filled Financial Model: MannKind Corporation’s actual data allows for accurate DCF valuation.
- Comprehensive Forecast Control: Modify revenue growth, profit margins, WACC, and other essential factors.
- Real-Time Calculations: Automatic updates provide immediate results as you adjust inputs.
- Investor-Ready Template: A polished Excel file crafted for high-quality valuation analysis.
- Customizable and Reusable: Designed for adaptability, enabling repeated use for in-depth forecasts.
Key Features
- Authentic MannKind Financials: Gain access to reliable pre-loaded historical data and future forecasts.
- Adjustable Forecast Parameters: Modify highlighted cells such as WACC, growth rates, and profit margins.
- Real-Time Calculations: Instant updates to DCF, Net Present Value (NPV), and cash flow assessments.
- Intuitive Visual Dashboard: Clear charts and summaries to help you interpret your valuation findings.
- Suitable for All Skill Levels: A straightforward, user-friendly design tailored for investors, CFOs, and consultants.
How It Works
- Step 1: Download the Excel file for MannKind Corporation (MNKD).
- Step 2: Review MannKind's pre-filled financial data and projections.
- Step 3: Adjust key inputs such as revenue growth, WACC, and tax rates (highlighted cells).
- Step 4: Observe the DCF model update in real-time as you modify assumptions.
- Step 5: Evaluate the outputs and leverage the results for investment decisions.
Why Choose This Calculator for MannKind Corporation (MNKD)?
- Designed for Experts: A sophisticated tool tailored for analysts, CFOs, and industry consultants.
- Accurate Data: MannKind's historical and projected financials are preloaded for precision.
- Flexible Scenario Analysis: Effortlessly simulate various forecasts and assumptions.
- Clear Results: Automatically computes intrinsic value, NPV, and essential metrics.
- User-Friendly: Comprehensive step-by-step instructions help you navigate the process.
Who Should Use MannKind Corporation (MNKD)?
- Healthcare Students: Explore the intricacies of biopharmaceutical valuation and apply theories with real-world data.
- Researchers: Utilize advanced models in studies related to diabetes and pulmonary diseases.
- Investors: Evaluate your investment strategies and assess the market potential of MannKind Corporation (MNKD).
- Market Analysts: Enhance your analysis process with a customizable financial model tailored for biopharma companies.
- Entrepreneurs: Understand how public biotech firms like MannKind Corporation (MNKD) navigate market challenges.
What the Template Contains
- Pre-Filled Data: Contains MannKind Corporation’s historical financials and projections.
- Discounted Cash Flow Model: An editable DCF valuation model featuring automated calculations.
- Weighted Average Cost of Capital (WACC): A specific sheet for calculating WACC using customized inputs.
- Key Financial Ratios: Evaluate MannKind’s profitability, efficiency, and leverage metrics.
- Customizable Inputs: Easily adjust revenue growth, margins, and tax rates.
- Clear Dashboard: Visual representations and tables summarizing essential valuation outcomes.
Disclaimer
All information, articles, and product details provided on this website are for general informational and educational purposes only. We do not claim any ownership over, nor do we intend to infringe upon, any trademarks, copyrights, logos, brand names, or other intellectual property mentioned or depicted on this site. Such intellectual property remains the property of its respective owners, and any references here are made solely for identification or informational purposes, without implying any affiliation, endorsement, or partnership.
We make no representations or warranties, express or implied, regarding the accuracy, completeness, or suitability of any content or products presented. Nothing on this website should be construed as legal, tax, investment, financial, medical, or other professional advice. In addition, no part of this site—including articles or product references—constitutes a solicitation, recommendation, endorsement, advertisement, or offer to buy or sell any securities, franchises, or other financial instruments, particularly in jurisdictions where such activity would be unlawful.
All content is of a general nature and may not address the specific circumstances of any individual or entity. It is not a substitute for professional advice or services. Any actions you take based on the information provided here are strictly at your own risk. You accept full responsibility for any decisions or outcomes arising from your use of this website and agree to release us from any liability in connection with your use of, or reliance upon, the content or products found herein.