
|
Montauk Renewables, Inc. (MNTK) DCF -Bewertung |
Fully Editable: Tailor To Your Needs In Excel Or Sheets
Professional Design: Trusted, Industry-Standard Templates
Investor-Approved Valuation Models
MAC/PC Compatible, Fully Unlocked
No Expertise Is Needed; Easy To Follow
Montauk Renewables, Inc. (MNTK) Bundle
Unser (MNTK) DCF-Taschenrechner für Genauigkeit entwickelt und ermöglicht es Ihnen, die Bewertung von Montauk Renewables, Inc. unter Verwendung realer Finanzdaten zu bewerten, und bietet vollständige Flexibilität, um alle wesentlichen Parameter für erweiterte Projektionen zu ändern.
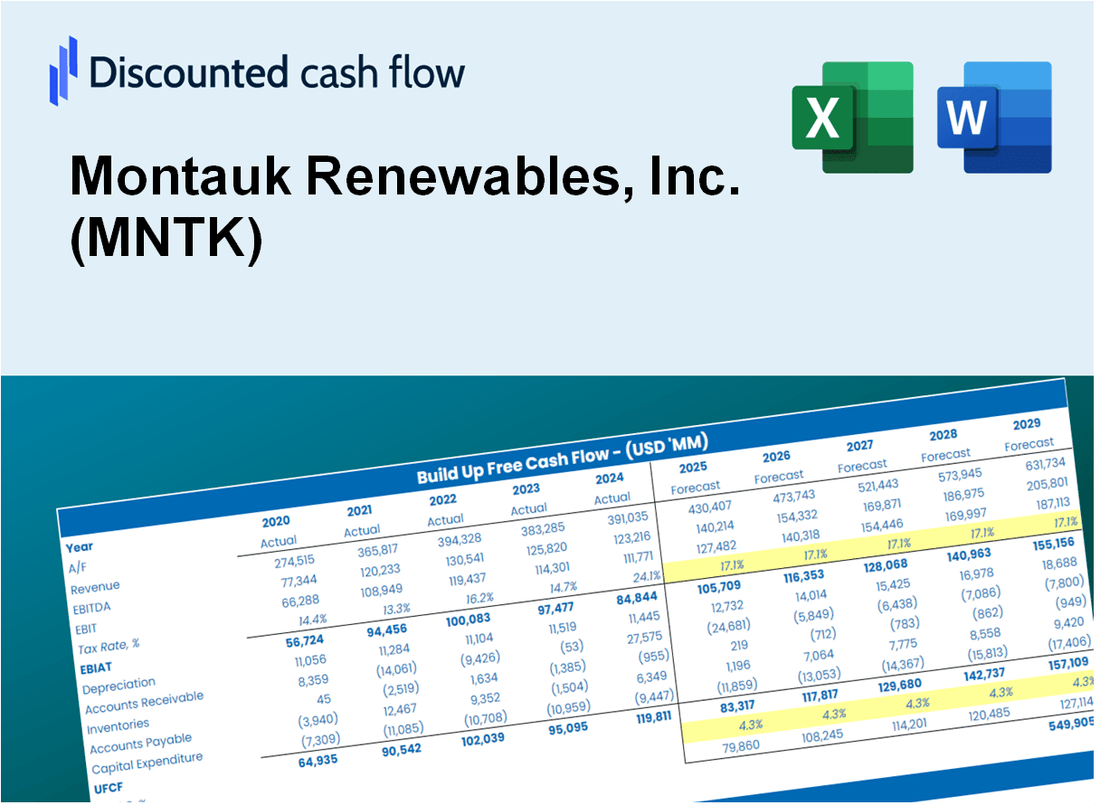
Discounted Cash Flow (DCF) - (USD MM)
| Year | AY1 2020 |
AY2 2021 |
AY3 2022 |
AY4 2023 |
AY5 2024 |
FY1 2025 |
FY2 2026 |
FY3 2027 |
FY4 2028 |
FY5 2029 |
|---|---|---|---|---|---|---|---|---|---|---|
| Revenue | 100.4 | 148.1 | 205.6 | 174.9 | 175.7 | 177.8 | 179.9 | 182.0 | 184.2 | 186.4 |
| Revenue Growth, % | 0 | 47.56 | 38.77 | -14.91 | 0.47569 | 1.18 | 1.18 | 1.18 | 1.18 | 1.18 |
| EBITDA | 25.1 | 25.4 | 65.7 | 45.1 | 41.0 | 43.8 | 44.3 | 44.9 | 45.4 | 45.9 |
| EBITDA, % | 24.97 | 17.17 | 31.98 | 25.8 | 23.31 | 24.65 | 24.65 | 24.65 | 24.65 | 24.65 |
| Depreciation | 22.1 | 22.9 | 20.7 | 21.6 | 23.5 | 26.1 | 26.4 | 26.7 | 27.0 | 27.3 |
| Depreciation, % | 22.03 | 15.44 | 10.07 | 12.33 | 13.38 | 14.65 | 14.65 | 14.65 | 14.65 | 14.65 |
| EBIT | 2.9 | 2.6 | 45.0 | 23.6 | 17.5 | 17.8 | 18.0 | 18.2 | 18.4 | 18.6 |
| EBIT, % | 2.93 | 1.73 | 21.91 | 13.47 | 9.93 | 9.99 | 9.99 | 9.99 | 9.99 | 9.99 |
| Total Cash | 21.0 | 53.3 | 105.2 | 73.8 | 45.6 | 62.7 | 63.4 | 64.2 | 64.9 | 65.7 |
| Total Cash, percent | .0 | .0 | .0 | .0 | .0 | .0 | .0 | .0 | .0 | .0 |
| Account Receivables | 5.4 | 18.3 | 16.2 | 12.8 | 8.2 | 13.4 | 13.5 | 13.7 | 13.9 | 14.0 |
| Account Receivables, % | 5.43 | 12.34 | 7.89 | 7.29 | 4.67 | 7.52 | 7.52 | 7.52 | 7.52 | 7.52 |
| Inventories | .0 | .0 | .0 | .0 | .0 | .0 | .0 | .0 | .0 | .0 |
| Inventories, % | 0 | 0 | 0 | 0 | 0 | 0 | 0 | 0 | 0 | 0 |
| Accounts Payable | 6.0 | 5.0 | 4.6 | 7.9 | 8.9 | 7.5 | 7.6 | 7.7 | 7.8 | 7.9 |
| Accounts Payable, % | 5.94 | 3.36 | 2.22 | 4.53 | 5.04 | 4.22 | 4.22 | 4.22 | 4.22 | 4.22 |
| Capital Expenditure | -17.6 | -10.0 | -22.3 | -63.1 | -62.3 | -37.9 | -38.4 | -38.8 | -39.3 | -39.8 |
| Capital Expenditure, % | -17.58 | -6.74 | -10.84 | -36.07 | -35.46 | -21.34 | -21.34 | -21.34 | -21.34 | -21.34 |
| Tax Rate, % | 20.06 | 20.06 | 20.06 | 20.06 | 20.06 | 20.06 | 20.06 | 20.06 | 20.06 | 20.06 |
| EBITAT | -9.7 | 31.6 | 36.7 | 19.2 | 14.0 | 12.2 | 12.3 | 12.5 | 12.6 | 12.8 |
| Depreciation | ||||||||||
| Changes in Account Receivables | ||||||||||
| Changes in Inventories | ||||||||||
| Changes in Accounts Payable | ||||||||||
| Capital Expenditure | ||||||||||
| UFCF | -4.7 | 30.7 | 36.7 | -15.5 | -19.4 | -6.2 | .2 | .2 | .2 | .2 |
| WACC, % | 3.81 | 5.38 | 5.08 | 5.08 | 5.06 | 4.88 | 4.88 | 4.88 | 4.88 | 4.88 |
| PV UFCF | ||||||||||
| SUM PV UFCF | -5.2 | |||||||||
| Long Term Growth Rate, % | 4.00 | |||||||||
| Free cash flow (T + 1) | 0 | |||||||||
| Terminal Value | 27 | |||||||||
| Present Terminal Value | 21 | |||||||||
| Enterprise Value | 16 | |||||||||
| Net Debt | 17 | |||||||||
| Equity Value | -1 | |||||||||
| Diluted Shares Outstanding, MM | 142 | |||||||||
| Equity Value Per Share | -0.01 |
What You Will Get
- Comprehensive MNTK Financials: Access historical and projected data for precise valuation.
- Customizable Variables: Adjust parameters like WACC, tax rates, revenue growth, and capital expenditures.
- Real-Time Calculations: Dynamic computation of intrinsic value and NPV.
- Scenario Analysis: Explore various scenarios to assess Montauk Renewables’ future performance.
- User-Friendly Interface: Designed for professionals while remaining approachable for newcomers.
Key Features
- Authentic Montauk Financials: Gain access to reliable pre-loaded historical data and future forecasts specific to Montauk Renewables, Inc. (MNTK).
- Adjustable Forecast Parameters: Modify highlighted cells for key metrics such as WACC, growth rates, and profit margins.
- Real-Time Calculations: Automatic updates for DCF, Net Present Value (NPV), and cash flow assessments.
- Interactive Dashboard: User-friendly charts and summaries to help visualize your valuation outcomes.
- Designed for All Skill Levels: An intuitive layout tailored for investors, CFOs, and consultants alike.
How It Works
- Step 1: Download the prebuilt Excel template featuring Montauk Renewables, Inc. (MNTK) data.
- Step 2: Navigate through the pre-filled sheets to familiarize yourself with the essential metrics.
- Step 3: Modify forecasts and assumptions in the editable yellow cells (WACC, growth, margins).
- Step 4: Instantly see the recalculated results, including Montauk’s intrinsic value.
- Step 5: Utilize the outputs to make informed investment decisions or create reports.
Why Choose Montauk Renewables, Inc. (MNTK)?
- Innovative Solutions: Cutting-edge technology for efficient renewable energy production.
- Environmental Impact: Contribute to a sustainable future with reduced carbon footprints.
- Expert Team: Leverage the knowledge of industry professionals dedicated to excellence.
- Proven Track Record: Reliable performance backed by successful projects and partnerships.
- Commitment to Growth: Focused on expanding renewable energy resources and market reach.
Who Should Use This Product?
- Investors: Evaluate Montauk Renewables, Inc. (MNTK) to make informed buying or selling decisions.
- CFOs and Financial Analysts: Enhance valuation workflows and assess financial forecasts.
- Startup Founders: Discover how leading renewable energy companies like Montauk are valued.
- Consultants: Provide clients with expert valuation reports based on Montauk's performance.
- Students and Educators: Utilize current data to practice and teach valuation methodologies in the renewable sector.
What the Template Contains
- Historical Data: Includes Montauk Renewables’ past financials and baseline forecasts.
- DCF and Levered DCF Models: Detailed templates to calculate Montauk Renewables’ intrinsic value.
- WACC Sheet: Pre-built calculations for Weighted Average Cost of Capital.
- Editable Inputs: Modify key drivers like growth rates, EBITDA %, and CAPEX assumptions.
- Quarterly and Annual Statements: A complete breakdown of Montauk Renewables’ financials.
- Interactive Dashboard: Visualize valuation results and projections dynamically.
Disclaimer
All information, articles, and product details provided on this website are for general informational and educational purposes only. We do not claim any ownership over, nor do we intend to infringe upon, any trademarks, copyrights, logos, brand names, or other intellectual property mentioned or depicted on this site. Such intellectual property remains the property of its respective owners, and any references here are made solely for identification or informational purposes, without implying any affiliation, endorsement, or partnership.
We make no representations or warranties, express or implied, regarding the accuracy, completeness, or suitability of any content or products presented. Nothing on this website should be construed as legal, tax, investment, financial, medical, or other professional advice. In addition, no part of this site—including articles or product references—constitutes a solicitation, recommendation, endorsement, advertisement, or offer to buy or sell any securities, franchises, or other financial instruments, particularly in jurisdictions where such activity would be unlawful.
All content is of a general nature and may not address the specific circumstances of any individual or entity. It is not a substitute for professional advice or services. Any actions you take based on the information provided here are strictly at your own risk. You accept full responsibility for any decisions or outcomes arising from your use of this website and agree to release us from any liability in connection with your use of, or reliance upon, the content or products found herein.