
|
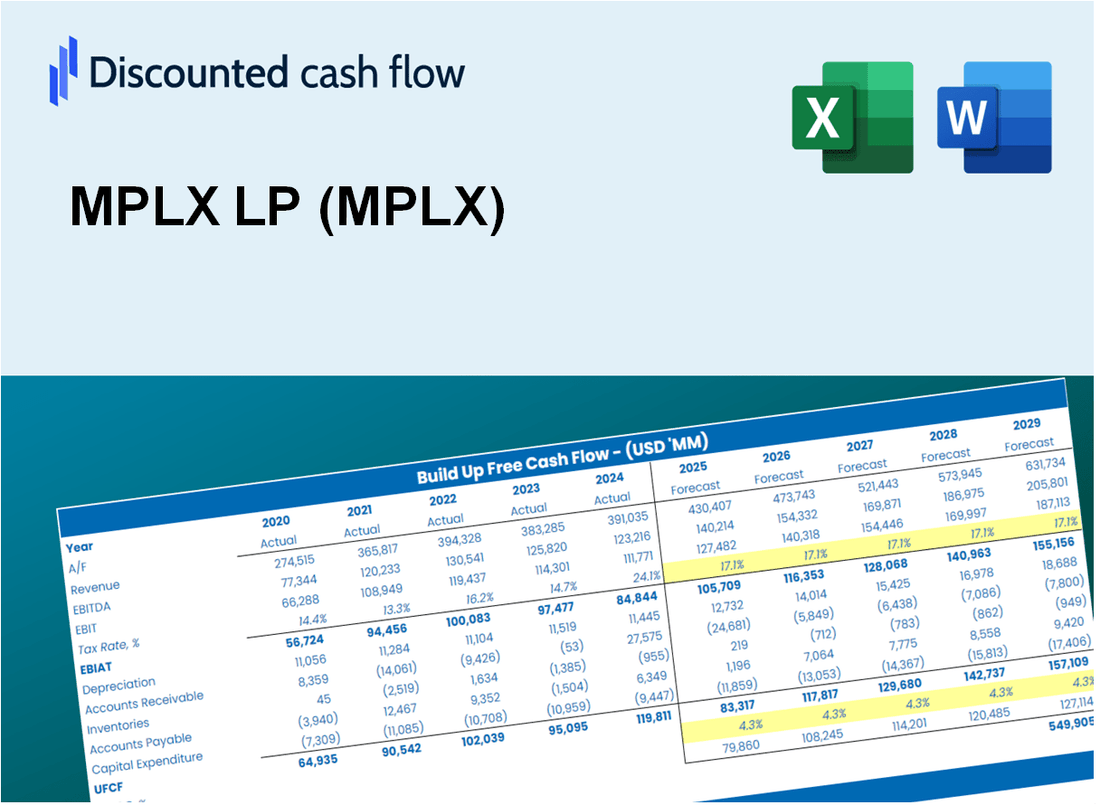
MPLX LP (MPLX) DCF -Bewertung |
Fully Editable: Tailor To Your Needs In Excel Or Sheets
Professional Design: Trusted, Industry-Standard Templates
Investor-Approved Valuation Models
MAC/PC Compatible, Fully Unlocked
No Expertise Is Needed; Easy To Follow
MPLX LP (MPLX) Bundle
Optimieren Sie Ihre Zeit und verbessern Sie die Präzision mit unserem DCF -Taschenrechner von MPLX LP (MPLX)! Dieses Tool, das mit echten Daten von MPLX und anpassbaren Annahmen ausgestattet ist, ermöglicht es Ihnen, MPLX wie einen erfahrenen Investor zu prognostizieren, zu analysieren und zu bewerten.
Discounted Cash Flow (DCF) - (USD MM)
| Year | AY1 2020 |
AY2 2021 |
AY3 2022 |
AY4 2023 |
AY5 2024 |
FY1 2025 |
FY2 2026 |
FY3 2027 |
FY4 2028 |
FY5 2029 |
|---|---|---|---|---|---|---|---|---|---|---|
| Revenue | 8,398.0 | 9,575.0 | 10,541.0 | 10,434.0 | 10,904.0 | 11,656.2 | 12,460.3 | 13,319.8 | 14,238.7 | 15,220.9 |
| Revenue Growth, % | 0 | 14.02 | 10.09 | -1.02 | 4.5 | 6.9 | 6.9 | 6.9 | 6.9 | 6.9 |
| EBITDA | 1,526.0 | 5,193.0 | 6,064.0 | 6,087.0 | 6,594.0 | 5,798.8 | 6,198.9 | 6,626.5 | 7,083.6 | 7,572.3 |
| EBITDA, % | 18.17 | 54.23 | 57.53 | 58.34 | 60.47 | 49.75 | 49.75 | 49.75 | 49.75 | 49.75 |
| Depreciation | 1,377.0 | 1,287.0 | 1,230.0 | 1,213.0 | 1,283.0 | 1,512.9 | 1,617.3 | 1,728.9 | 1,848.1 | 1,975.6 |
| Depreciation, % | 16.4 | 13.44 | 11.67 | 11.63 | 11.77 | 12.98 | 12.98 | 12.98 | 12.98 | 12.98 |
| EBIT | 149.0 | 3,906.0 | 4,834.0 | 4,874.0 | 5,311.0 | 4,285.9 | 4,581.6 | 4,897.6 | 5,235.5 | 5,596.6 |
| EBIT, % | 1.77 | 40.79 | 45.86 | 46.71 | 48.71 | 36.77 | 36.77 | 36.77 | 36.77 | 36.77 |
| Total Cash | 15.0 | 13.0 | 238.0 | 1,048.0 | 1,519.0 | 618.9 | 661.6 | 707.2 | 756.0 | 808.1 |
| Total Cash, percent | .0 | .0 | .0 | .0 | .0 | .0 | .0 | .0 | .0 | .0 |
| Account Receivables | 1,164.0 | 1,316.0 | 1,479.0 | 1,562.0 | 1,544.0 | 1,649.7 | 1,763.5 | 1,885.2 | 2,015.2 | 2,154.2 |
| Account Receivables, % | 13.86 | 13.74 | 14.03 | 14.97 | 14.16 | 14.15 | 14.15 | 14.15 | 14.15 | 14.15 |
| Inventories | 118.0 | 142.0 | 148.0 | 159.0 | 180.0 | 174.1 | 186.1 | 198.9 | 212.6 | 227.3 |
| Inventories, % | 1.41 | 1.48 | 1.4 | 1.52 | 1.65 | 1.49 | 1.49 | 1.49 | 1.49 | 1.49 |
| Accounts Payable | 367.0 | 172.0 | 224.0 | 153.0 | 147.0 | 258.9 | 276.8 | 295.9 | 316.3 | 338.1 |
| Accounts Payable, % | 4.37 | 1.8 | 2.13 | 1.47 | 1.35 | 2.22 | 2.22 | 2.22 | 2.22 | 2.22 |
| Capital Expenditure | -1,183.0 | -529.0 | -806.0 | -937.0 | -1,056.0 | -1,070.6 | -1,144.4 | -1,223.4 | -1,307.8 | -1,398.0 |
| Capital Expenditure, % | -14.09 | -5.52 | -7.65 | -8.98 | -9.68 | -9.18 | -9.18 | -9.18 | -9.18 | -9.18 |
| Tax Rate, % | 1.14 | 1.14 | 1.14 | 1.14 | 1.14 | 1.14 | 1.14 | 1.14 | 1.14 | 1.14 |
| EBITAT | 156.6 | 3,860.8 | 4,783.1 | 4,813.9 | 5,250.2 | 4,246.6 | 4,539.5 | 4,852.7 | 5,187.4 | 5,545.3 |
| Depreciation | ||||||||||
| Changes in Account Receivables | ||||||||||
| Changes in Inventories | ||||||||||
| Changes in Accounts Payable | ||||||||||
| Capital Expenditure | ||||||||||
| UFCF | -564.4 | 4,247.8 | 5,090.1 | 4,924.9 | 5,468.2 | 4,701.1 | 4,904.5 | 5,242.8 | 5,604.5 | 5,991.1 |
| WACC, % | 6 | 5.98 | 5.98 | 5.98 | 5.98 | 5.98 | 5.98 | 5.98 | 5.98 | 5.98 |
| PV UFCF | ||||||||||
| SUM PV UFCF | 22,127.5 | |||||||||
| Long Term Growth Rate, % | 1.00 | |||||||||
| Free cash flow (T + 1) | 6,051 | |||||||||
| Terminal Value | 121,384 | |||||||||
| Present Terminal Value | 90,770 | |||||||||
| Enterprise Value | 112,897 | |||||||||
| Net Debt | 19,917 | |||||||||
| Equity Value | 92,980 | |||||||||
| Diluted Shares Outstanding, MM | 1,017 | |||||||||
| Equity Value Per Share | 91.43 |
What You Will Receive
- Comprehensive Financial Model: Utilize MPLX LP’s actual data for accurate DCF valuation.
- Full Forecast Customization: Modify revenue growth, profit margins, WACC, and other essential parameters.
- Real-Time Calculations: Automatic updates allow you to view results instantly as adjustments are made.
- Professional-Grade Template: An expertly crafted Excel file ready for investor presentations.
- Adaptable and Reusable: Designed for versatility, enabling consistent use for in-depth forecasts.
Key Features
- 🔍 Real-Life MPLX Financials: Pre-filled historical and projected data for MPLX LP (MPLX).
- ✏️ Fully Customizable Inputs: Adjust all critical parameters (yellow cells) like WACC, growth %, and tax rates.
- 📊 Professional DCF Valuation: Built-in formulas calculate MPLX’s intrinsic value using the Discounted Cash Flow method.
- ⚡ Instant Results: Visualize MPLX’s valuation instantly after making changes.
- Scenario Analysis: Test and compare outcomes for various financial assumptions side-by-side.
How It Works
- Download the Template: Gain immediate access to the Excel-based MPLX DCF Calculator.
- Input Your Assumptions: Modify the yellow-highlighted cells for growth rates, WACC, margins, and other key parameters.
- Instant Calculations: The model automatically recalculates MPLX's intrinsic value.
- Test Scenarios: Experiment with various assumptions to see how they affect valuation outcomes.
- Analyze and Decide: Leverage the results to inform your investment or financial strategy.
Why Choose the MPLX LP (MPLX) Calculator?
- Precision: Utilizes accurate MPLX financial data for reliable calculations.
- Adaptability: Allows users to easily test and adjust inputs as needed.
- Efficiency: Eliminate the complexities of creating a DCF model from the ground up.
- Expert-Quality: Crafted with the precision and functionality expected at the CFO level.
- Intuitive: Simple to navigate, even for those without extensive financial modeling skills.
Who Should Use This Product?
- Individual Investors: Make informed decisions about buying or selling MPLX LP (MPLX) stock.
- Financial Analysts: Streamline valuation processes with ready-to-use financial models for MPLX LP (MPLX).
- Consultants: Deliver professional valuation insights on MPLX LP (MPLX) to clients quickly and accurately.
- Business Owners: Understand how companies like MPLX LP (MPLX) are valued to guide your own strategy.
- Finance Students: Learn valuation techniques using real-world data and scenarios related to MPLX LP (MPLX).
What the Template Contains
- Pre-Filled Data: Includes MPLX LP’s historical financials and forecasts.
- Discounted Cash Flow Model: Editable DCF valuation model with automatic calculations.
- Weighted Average Cost of Capital (WACC): A dedicated sheet for calculating WACC based on custom inputs.
- Key Financial Ratios: Analyze MPLX LP’s profitability, efficiency, and leverage.
- Customizable Inputs: Edit revenue growth, margins, and tax rates with ease.
- Clear Dashboard: Charts and tables summarizing key valuation results.
Disclaimer
All information, articles, and product details provided on this website are for general informational and educational purposes only. We do not claim any ownership over, nor do we intend to infringe upon, any trademarks, copyrights, logos, brand names, or other intellectual property mentioned or depicted on this site. Such intellectual property remains the property of its respective owners, and any references here are made solely for identification or informational purposes, without implying any affiliation, endorsement, or partnership.
We make no representations or warranties, express or implied, regarding the accuracy, completeness, or suitability of any content or products presented. Nothing on this website should be construed as legal, tax, investment, financial, medical, or other professional advice. In addition, no part of this site—including articles or product references—constitutes a solicitation, recommendation, endorsement, advertisement, or offer to buy or sell any securities, franchises, or other financial instruments, particularly in jurisdictions where such activity would be unlawful.
All content is of a general nature and may not address the specific circumstances of any individual or entity. It is not a substitute for professional advice or services. Any actions you take based on the information provided here are strictly at your own risk. You accept full responsibility for any decisions or outcomes arising from your use of this website and agree to release us from any liability in connection with your use of, or reliance upon, the content or products found herein.