
|
MRF Limited (MRF.NS) DCF -Bewertung |
Fully Editable: Tailor To Your Needs In Excel Or Sheets
Professional Design: Trusted, Industry-Standard Templates
Investor-Approved Valuation Models
MAC/PC Compatible, Fully Unlocked
No Expertise Is Needed; Easy To Follow
MRF Limited (MRF.NS) Bundle
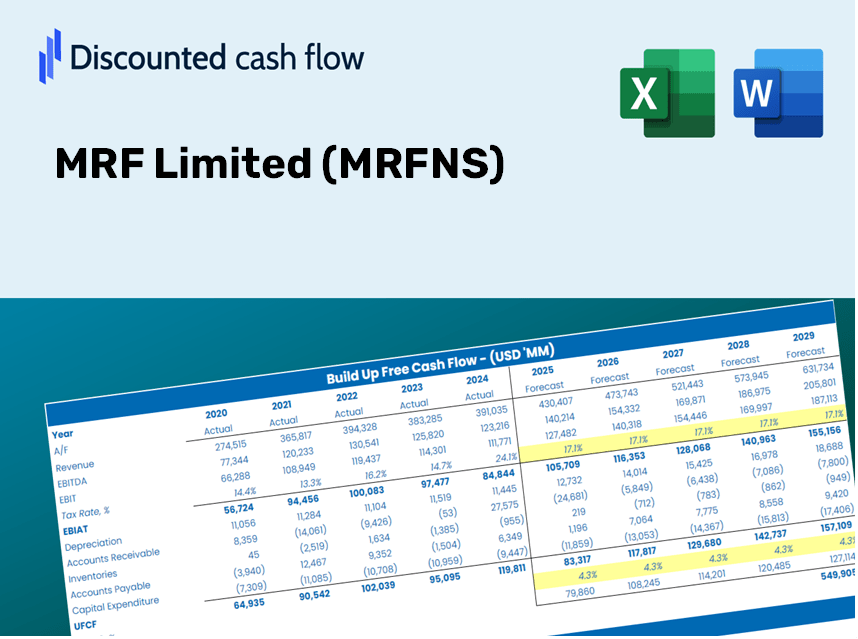
Unabhängig davon, ob Sie ein Investor oder Analyst sind, ist dieser MRF Limited (MRFNS) DCF-Taschenrechner Ihr Anlaufwerk für eine genaue Bewertung. Mit den tatsächlichen Daten von MRF Limited werden Sie Prognosen anpassen und die Effekte in Echtzeit beobachten.
Discounted Cash Flow (DCF) - (USD MM)
| Year | AY1 2021 |
AY2 2022 |
AY3 2023 |
AY4 2024 |
AY5 2025 |
FY1 2026 |
FY2 2027 |
FY3 2028 |
FY4 2029 |
FY5 2030 |
|---|---|---|---|---|---|---|---|---|---|---|
| Revenue | 161,846.2 | 193,318.1 | 230,150.2 | 251,736.2 | 281,710.4 | 323,815.0 | 372,212.6 | 427,843.7 | 491,789.4 | 565,292.6 |
| Revenue Growth, % | 0 | 19.45 | 19.05 | 9.38 | 11.91 | 14.95 | 14.95 | 14.95 | 14.95 | 14.95 |
| EBITDA | 29,523.6 | 20,702.5 | 23,481.5 | 41,947.0 | 40,172.6 | 45,383.8 | 52,166.9 | 59,963.8 | 68,926.1 | 79,227.8 |
| EBITDA, % | 18.24 | 10.71 | 10.2 | 16.66 | 14.26 | 14.02 | 14.02 | 14.02 | 14.02 | 14.02 |
| Depreciation | 10,547.8 | 11,217.0 | 11,530.2 | 13,043.0 | 15,052.1 | 18,038.9 | 20,735.0 | 23,834.1 | 27,396.3 | 31,491.0 |
| Depreciation, % | 6.52 | 5.8 | 5.01 | 5.18 | 5.34 | 5.57 | 5.57 | 5.57 | 5.57 | 5.57 |
| EBIT | 18,975.8 | 9,485.5 | 11,951.3 | 28,904.0 | 25,120.5 | 27,344.9 | 31,431.9 | 36,129.8 | 41,529.7 | 47,736.8 |
| EBIT, % | 11.72 | 4.91 | 5.19 | 11.48 | 8.92 | 8.44 | 8.44 | 8.44 | 8.44 | 8.44 |
| Total Cash | 49,111.0 | 34,055.0 | 22,233.5 | 27,465.7 | 39,280.6 | 53,413.2 | 61,396.3 | 70,572.7 | 81,120.5 | 93,244.8 |
| Total Cash, percent | .0 | .0 | .0 | .0 | .0 | .0 | .0 | .0 | .0 | .0 |
| Account Receivables | 21,459.6 | 25,346.1 | 26,823.8 | 31,520.5 | 33,752.7 | 40,494.9 | 46,547.3 | 53,504.3 | 61,501.1 | 70,693.0 |
| Account Receivables, % | 13.26 | 13.11 | 11.65 | 12.52 | 11.98 | 12.51 | 12.51 | 12.51 | 12.51 | 12.51 |
| Inventories | 29,388.1 | 41,296.7 | 41,410.5 | 44,685.8 | 56,247.8 | 61,674.1 | 70,892.0 | 81,487.5 | 93,666.7 | 107,666.2 |
| Inventories, % | 18.16 | 21.36 | 17.99 | 17.75 | 19.97 | 19.05 | 19.05 | 19.05 | 19.05 | 19.05 |
| Accounts Payable | 33,061.4 | 20,567.8 | 24,357.7 | 28,534.2 | 28,220.0 | 40,802.5 | 46,900.8 | 53,910.7 | 61,968.2 | 71,230.0 |
| Accounts Payable, % | 20.43 | 10.64 | 10.58 | 11.33 | 10.02 | 12.6 | 12.6 | 12.6 | 12.6 | 12.6 |
| Capital Expenditure | -8,527.4 | -17,070.1 | -32,912.4 | -21,623.2 | -13,081.7 | -26,962.5 | -30,992.3 | -35,624.5 | -40,948.9 | -47,069.2 |
| Capital Expenditure, % | -5.27 | -8.83 | -14.3 | -8.59 | -4.64 | -8.33 | -8.33 | -8.33 | -8.33 | -8.33 |
| Tax Rate, % | 24.6 | 24.6 | 24.6 | 24.6 | 24.6 | 24.6 | 24.6 | 24.6 | 24.6 | 24.6 |
| EBITAT | 13,952.5 | 6,991.7 | 8,590.8 | 21,581.1 | 18,942.0 | 20,190.8 | 23,208.6 | 26,677.3 | 30,664.6 | 35,247.7 |
| Depreciation | ||||||||||
| Changes in Account Receivables | ||||||||||
| Changes in Inventories | ||||||||||
| Changes in Accounts Payable | ||||||||||
| Capital Expenditure | ||||||||||
| UFCF | -1,813.4 | -27,150.1 | -10,593.0 | 9,205.4 | 6,804.0 | 11,681.2 | 3,779.4 | 4,344.2 | 4,993.5 | 5,739.9 |
| WACC, % | 5.4 | 5.4 | 5.4 | 5.41 | 5.41 | 5.41 | 5.41 | 5.41 | 5.41 | 5.41 |
| PV UFCF | ||||||||||
| SUM PV UFCF | 26,650.4 | |||||||||
| Long Term Growth Rate, % | 4.00 | |||||||||
| Free cash flow (T + 1) | 5,969 | |||||||||
| Terminal Value | 424,821 | |||||||||
| Present Terminal Value | 326,510 | |||||||||
| Enterprise Value | 353,161 | |||||||||
| Net Debt | 34,005 | |||||||||
| Equity Value | 319,155 | |||||||||
| Diluted Shares Outstanding, MM | 4 | |||||||||
| Equity Value Per Share | 75,254.74 |
Benefits You Will Receive
- Authentic MRF Data: Comprehensive financials – encompassing revenue to EBIT – derived from actual and anticipated figures.
- Complete Customization: Modify all essential parameters (yellow cells) such as WACC, growth %, and tax rates to suit your analysis.
- Real-Time Valuation Adjustments: Automatic recalculations allow you to assess the influence of changes on MRF Limited’s fair value.
- Flexible Excel Template: Designed for swift modifications, scenario tests, and thorough projections.
- Efficient and Precise: Avoid the hassle of constructing models from the ground up while ensuring accuracy and adaptability.
Key Features
- Comprehensive Historical Data: MRF Limited's financial statements and predictive forecasts are pre-loaded.
- Customizable Inputs: Modify WACC, tax rates, revenue growth, and EBITDA margins to fit your analysis.
- Real-Time Results: Watch MRF Limited's intrinsic value update seamlessly as you make adjustments.
- User-Friendly Visuals: Intuitive dashboard charts present valuation outcomes and essential metrics clearly.
- Precision-Engineered: A robust tool designed for analysts, investors, and financial professionals.
How It Works
- Step 1: Download the Excel file.
- Step 2: Examine MRF Limited's (MRFNS) pre-filled financial data and projections.
- Step 3: Adjust key parameters such as revenue growth, WACC, and tax rates (identified in highlighted cells).
- Step 4: Observe the DCF model refresh in real-time as you modify your assumptions.
- Step 5: Evaluate the results and leverage the insights for your investment strategies.
Why Opt for This Calculator?
- Designed for Experts: A sophisticated tool tailored for analysts, CFOs, and consultants.
- Accurate Financial Data: MRF Limited’s historical and projected financial information is preloaded for precision.
- Scenario Analysis: Effortlessly test various forecasts and assumptions.
- Clear Results: Instantly computes intrinsic value, NPV, and essential metrics.
- User-Friendly: Comprehensive, step-by-step instructions guide you through each stage.
Who Can Benefit from MRF Limited (MRFNS)?
- Investors: Gain the confidence to make informed choices with our expert valuation tool.
- Financial Analysts: Streamline your workflow with a customizable, ready-to-use DCF model.
- Consultants: Effortlessly modify the template for impactful client presentations or comprehensive reports.
- Finance Enthusiasts: Enhance your knowledge of valuation methods through applicable real-world case studies.
- Educators and Students: Utilize this resource as a hands-on learning aid in finance education.
What the Template Contains
- Preloaded MRF Data: Historical and projected financial information, covering revenue, EBIT, and capital expenditures.
- DCF and WACC Models: Professional-grade templates for calculating intrinsic value and Weighted Average Cost of Capital.
- Editable Inputs: Yellow-highlighted cells for modifying revenue growth, tax rates, and discount rates.
- Financial Statements: Detailed annual and quarterly financials for in-depth analysis.
- Key Ratios: Profitability, leverage, and efficiency ratios to assess performance.
- Dashboard and Charts: Visual representations of valuation outcomes and underlying assumptions.
Disclaimer
All information, articles, and product details provided on this website are for general informational and educational purposes only. We do not claim any ownership over, nor do we intend to infringe upon, any trademarks, copyrights, logos, brand names, or other intellectual property mentioned or depicted on this site. Such intellectual property remains the property of its respective owners, and any references here are made solely for identification or informational purposes, without implying any affiliation, endorsement, or partnership.
We make no representations or warranties, express or implied, regarding the accuracy, completeness, or suitability of any content or products presented. Nothing on this website should be construed as legal, tax, investment, financial, medical, or other professional advice. In addition, no part of this site—including articles or product references—constitutes a solicitation, recommendation, endorsement, advertisement, or offer to buy or sell any securities, franchises, or other financial instruments, particularly in jurisdictions where such activity would be unlawful.
All content is of a general nature and may not address the specific circumstances of any individual or entity. It is not a substitute for professional advice or services. Any actions you take based on the information provided here are strictly at your own risk. You accept full responsibility for any decisions or outcomes arising from your use of this website and agree to release us from any liability in connection with your use of, or reliance upon, the content or products found herein.