
|
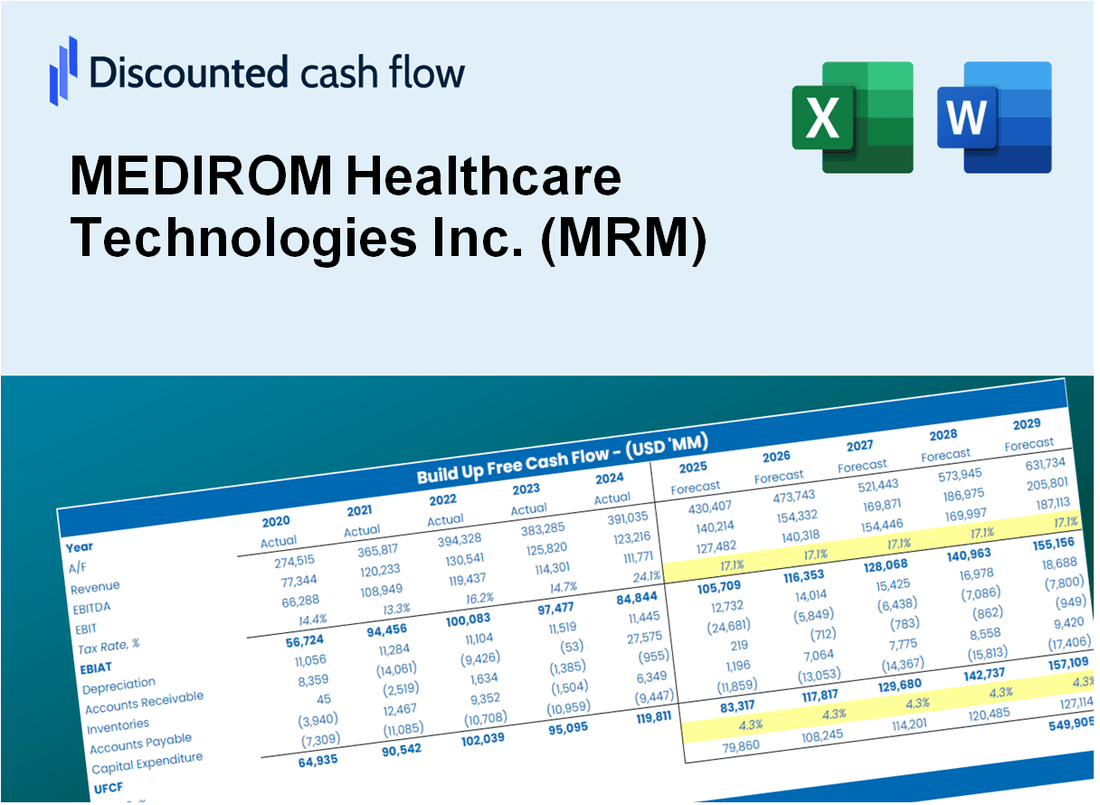
Medirom Healthcare Technologies Inc. (MRM) DCF -Bewertung |
Fully Editable: Tailor To Your Needs In Excel Or Sheets
Professional Design: Trusted, Industry-Standard Templates
Investor-Approved Valuation Models
MAC/PC Compatible, Fully Unlocked
No Expertise Is Needed; Easy To Follow
MEDIROM Healthcare Technologies Inc. (MRM) Bundle
Entdecken Sie die finanzielle Zukunft von Medirom Healthcare Technologies Inc. (MRM) mit unserem benutzerfreundlichen DCF-Taschenrechner! Geben Sie Ihre Annahmen in Bezug auf Wachstum, Margen und Kosten für die Berechnung des inneren Werts von Medirom Healthcare Technologies Inc. (MRM) ein und verfeinern Sie Ihre Anlagestrategie.
What You Will Get
- Real MEDIROM Data: Preloaded financials – from revenue to EBIT – based on actual and projected figures for MEDIROM Healthcare Technologies Inc. (MRM).
- Full Customization: Adjust all critical parameters (yellow cells) like WACC, growth %, and tax rates specific to MEDIROM.
- Instant Valuation Updates: Automatic recalculations to analyze the impact of changes on MEDIROM’s fair value.
- Versatile Excel Template: Tailored for quick edits, scenario testing, and detailed projections for MEDIROM.
- Time-Saving and Accurate: Skip building models from scratch while maintaining precision and flexibility for MEDIROM Healthcare Technologies Inc. (MRM).
Key Features
- Comprehensive MRM Data: Pre-loaded with MEDIROM's historical performance metrics and future projections.
- Customizable Variables: Tailor inputs for revenue growth, profit margins, discount rates, tax implications, and capital investments.
- Interactive Valuation Framework: Instant recalculations of Net Present Value (NPV) and intrinsic value based on your adjustments.
- Multiple Scenario Analysis: Develop various forecasting scenarios to evaluate different valuation possibilities.
- Intuitive User Interface: Clean, organized design suitable for both seasoned professionals and newcomers.
How It Works
- Step 1: Download the prebuilt Excel template featuring MEDIROM Healthcare Technologies Inc. (MRM) data.
- Step 2: Navigate through the pre-filled sheets to familiarize yourself with the essential metrics.
- Step 3: Modify forecasts and assumptions in the editable yellow cells (WACC, growth, margins).
- Step 4: Instantly view updated results, including MEDIROM's intrinsic value.
- Step 5: Make well-informed investment choices or create reports based on the outputs.
Why Choose MEDIROM Healthcare Technologies Inc. (MRM) Calculator?
- Designed for Experts: A sophisticated tool utilized by healthcare analysts, financial officers, and industry consultants.
- Comprehensive Data: MEDIROM’s historical and projected financials are preloaded for precise analysis.
- Flexible Scenario Analysis: Effortlessly simulate various forecasts and assumptions.
- Insightful Outputs: Automatically computes intrinsic value, NPV, and essential metrics.
- User-Friendly: Step-by-step guidance simplifies the entire process.
Who Should Use MEDIROM Healthcare Technologies Inc. (MRM)?
- Healthcare Professionals: Explore innovative healthcare solutions and their implementation in practice.
- Researchers: Utilize MEDIROM's technologies in studies focused on health and wellness.
- Investors: Evaluate market potential and investment opportunities within the healthcare sector.
- Analysts: Access comprehensive data to enhance your analysis of MEDIROM's market performance.
- Entrepreneurs: Discover how MEDIROM's technologies can inspire new business ventures in healthcare.
What the Template Contains
- Comprehensive DCF Model: Editable template featuring detailed valuation calculations specific to MEDIROM Healthcare Technologies Inc. (MRM).
- Real-World Data: MEDIROM's historical and projected financials preloaded for in-depth analysis.
- Customizable Parameters: Modify WACC, growth rates, and tax assumptions to explore various scenarios.
- Financial Statements: Complete annual and quarterly breakdowns for enhanced insights.
- Key Ratios: Integrated analysis for profitability, efficiency, and leverage metrics.
- Dashboard with Visual Outputs: Charts and tables providing clear, actionable results tailored to MEDIROM Healthcare Technologies Inc. (MRM).
Disclaimer
All information, articles, and product details provided on this website are for general informational and educational purposes only. We do not claim any ownership over, nor do we intend to infringe upon, any trademarks, copyrights, logos, brand names, or other intellectual property mentioned or depicted on this site. Such intellectual property remains the property of its respective owners, and any references here are made solely for identification or informational purposes, without implying any affiliation, endorsement, or partnership.
We make no representations or warranties, express or implied, regarding the accuracy, completeness, or suitability of any content or products presented. Nothing on this website should be construed as legal, tax, investment, financial, medical, or other professional advice. In addition, no part of this site—including articles or product references—constitutes a solicitation, recommendation, endorsement, advertisement, or offer to buy or sell any securities, franchises, or other financial instruments, particularly in jurisdictions where such activity would be unlawful.
All content is of a general nature and may not address the specific circumstances of any individual or entity. It is not a substitute for professional advice or services. Any actions you take based on the information provided here are strictly at your own risk. You accept full responsibility for any decisions or outcomes arising from your use of this website and agree to release us from any liability in connection with your use of, or reliance upon, the content or products found herein.