
|
Maravai Lifesciences Holdings, Inc. (MRVI) DCF -Bewertung |
Fully Editable: Tailor To Your Needs In Excel Or Sheets
Professional Design: Trusted, Industry-Standard Templates
Investor-Approved Valuation Models
MAC/PC Compatible, Fully Unlocked
No Expertise Is Needed; Easy To Follow
Maravai LifeSciences Holdings, Inc. (MRVI) Bundle
Gewinnen Sie einen Einblick in Ihre Maravai Lifesciences Holdings, Inc. (MRVI) Bewertungsanalyse mit unserem erweiterten DCF -Taschenrechner! Diese Excel -Vorlage mit realen (MRVI-) Daten ermöglicht es Ihnen, Vorhersagen und Annahmen anzupassen, wodurch eine präzise Berechnung des intrinsischen Wertes von Maravai Lifesciences ermöglicht wird.
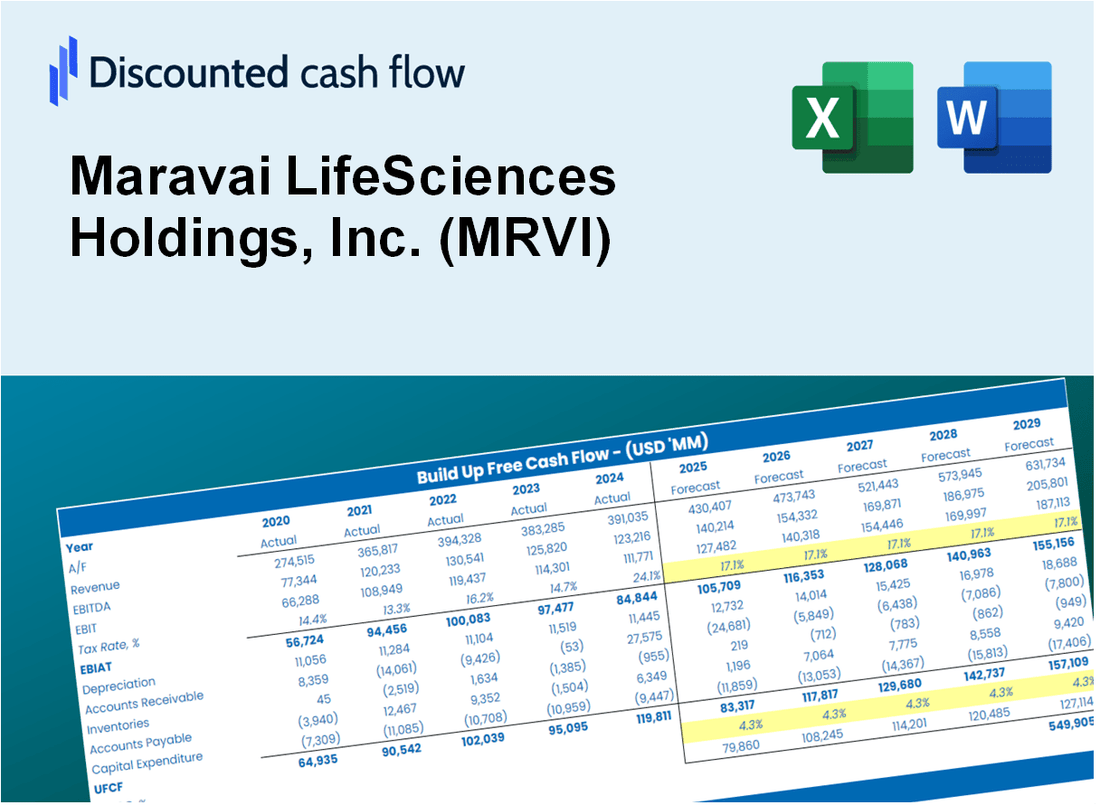
Discounted Cash Flow (DCF) - (USD MM)
| Year | AY1 2020 |
AY2 2021 |
AY3 2022 |
AY4 2023 |
AY5 2024 |
FY1 2025 |
FY2 2026 |
FY3 2027 |
FY4 2028 |
FY5 2029 |
|---|---|---|---|---|---|---|---|---|---|---|
| Revenue | 284.1 | 799.2 | 883.0 | 288.9 | 259.2 | 280.5 | 303.6 | 328.6 | 355.6 | 384.8 |
| Revenue Growth, % | 0 | 181.33 | 10.48 | -67.28 | -10.3 | 8.23 | 8.23 | 8.23 | 8.23 | 8.23 |
| EBITDA | 138.3 | 585.8 | 610.0 | 712.4 | -156.9 | 129.3 | 140.0 | 151.5 | 163.9 | 177.4 |
| EBITDA, % | 48.67 | 73.29 | 69.08 | 246.56 | -60.54 | 46.1 | 46.1 | 46.1 | 46.1 | 46.1 |
| Depreciation | 25.8 | 24.8 | 38.1 | 48.8 | 56.9 | 31.0 | 33.6 | 36.4 | 39.3 | 42.6 |
| Depreciation, % | 9.09 | 3.1 | 4.32 | 16.88 | 21.94 | 11.07 | 11.07 | 11.07 | 11.07 | 11.07 |
| EBIT | 112.4 | 561.0 | 571.9 | 663.6 | -213.8 | 107.7 | 116.6 | 126.2 | 136.6 | 147.8 |
| EBIT, % | 39.58 | 70.19 | 64.77 | 229.67 | -82.48 | 38.41 | 38.41 | 38.41 | 38.41 | 38.41 |
| Total Cash | 236.2 | 551.3 | 632.1 | 575.0 | 322.4 | 237.7 | 257.3 | 278.4 | 301.3 | 326.1 |
| Total Cash, percent | .0 | .0 | .0 | .0 | .0 | .0 | .0 | .0 | .0 | .0 |
| Account Receivables | 51.0 | 117.5 | 146.8 | 55.7 | 38.5 | 46.8 | 50.7 | 54.8 | 59.3 | 64.2 |
| Account Receivables, % | 17.96 | 14.7 | 16.63 | 19.28 | 14.86 | 16.69 | 16.69 | 16.69 | 16.69 | 16.69 |
| Inventories | 33.3 | 51.6 | 43.2 | 51.4 | 50.1 | 33.8 | 36.5 | 39.5 | 42.8 | 46.3 |
| Inventories, % | 11.72 | 6.45 | 4.89 | 17.79 | 19.32 | 12.03 | 12.03 | 12.03 | 12.03 | 12.03 |
| Accounts Payable | 3.0 | 8.2 | 6.0 | 10.7 | 12.0 | 6.2 | 6.7 | 7.3 | 7.9 | 8.5 |
| Accounts Payable, % | 1.05 | 1.02 | 0.67848 | 3.71 | 4.61 | 2.22 | 2.22 | 2.22 | 2.22 | 2.22 |
| Capital Expenditure | -25.4 | -14.9 | -17.1 | -65.6 | -29.7 | -26.3 | -28.5 | -30.8 | -33.3 | -36.1 |
| Capital Expenditure, % | -8.94 | -1.86 | -1.94 | -22.69 | -11.44 | -9.37 | -9.37 | -9.37 | -9.37 | -9.37 |
| Tax Rate, % | 44.61 | 44.61 | 44.61 | 44.61 | 44.61 | 44.61 | 44.61 | 44.61 | 44.61 | 44.61 |
| EBITAT | 105.8 | 192.4 | 228.4 | -127.9 | -118.4 | 48.2 | 52.2 | 56.5 | 61.1 | 66.1 |
| Depreciation | ||||||||||
| Changes in Account Receivables | ||||||||||
| Changes in Inventories | ||||||||||
| Changes in Accounts Payable | ||||||||||
| Capital Expenditure | ||||||||||
| UFCF | 24.9 | 122.7 | 226.3 | -57.1 | -71.5 | 55.3 | 51.2 | 55.4 | 60.0 | 64.9 |
| WACC, % | 8.17 | 4.92 | 5.23 | 3.06 | 6.07 | 5.49 | 5.49 | 5.49 | 5.49 | 5.49 |
| PV UFCF | ||||||||||
| SUM PV UFCF | 243.7 | |||||||||
| Long Term Growth Rate, % | 1.00 | |||||||||
| Free cash flow (T + 1) | 66 | |||||||||
| Terminal Value | 1,461 | |||||||||
| Present Terminal Value | 1,118 | |||||||||
| Enterprise Value | 1,362 | |||||||||
| Net Debt | 54 | |||||||||
| Equity Value | 1,308 | |||||||||
| Diluted Shares Outstanding, MM | 138 | |||||||||
| Equity Value Per Share | 9.48 |
What You Will Get
- Real Maravai Data: Preloaded financials – from revenue to EBIT – based on actual and projected figures for Maravai LifeSciences Holdings, Inc. (MRVI).
- Full Customization: Adjust all critical parameters (yellow cells) like WACC, growth %, and tax rates tailored for MRVI.
- Instant Valuation Updates: Automatic recalculations to analyze the impact of changes on Maravai’s fair value.
- Versatile Excel Template: Designed for quick edits, scenario testing, and detailed projections specific to Maravai LifeSciences Holdings, Inc. (MRVI).
- Time-Saving and Accurate: Avoid building models from scratch while ensuring precision and flexibility for MRVI.
Key Features
- Comprehensive DCF Calculator: Offers detailed unlevered and levered DCF valuation models tailored for Maravai LifeSciences Holdings, Inc. (MRVI).
- WACC Calculator: Pre-configured Weighted Average Cost of Capital sheet with adjustable inputs specific to MRVI.
- Customizable Forecast Assumptions: Adjust growth rates, capital expenditures, and discount rates to fit Maravai's projections.
- Integrated Financial Ratios: Evaluate profitability, leverage, and efficiency ratios relevant to Maravai LifeSciences.
- Interactive Dashboard and Charts: Visual representations highlight essential valuation metrics for streamlined analysis.
How It Works
- Step 1: Download the Excel file.
- Step 2: Review pre-entered Maravai LifeSciences data (historical and projected).
- Step 3: Adjust key assumptions (yellow cells) based on your analysis.
- Step 4: View automatic recalculations for Maravai’s intrinsic value.
- Step 5: Use the outputs for investment decisions or reporting.
Why Choose Maravai LifeSciences Holdings, Inc. (MRVI)?
- Save Time: Quickly access essential data without the hassle of complex calculations.
- Enhance Accuracy: Utilize dependable scientific data and methodologies to minimize errors in research and development.
- Fully Customizable: Adjust parameters to align with your specific scientific needs and forecasts.
- Easy to Understand: Intuitive visualizations and outputs facilitate straightforward interpretation of results.
- Endorsed by Professionals: Developed for industry experts who prioritize accuracy and efficiency.
Who Should Use This Product?
- Investors: Accurately assess Maravai LifeSciences' fair value before making investment choices.
- CFOs: Utilize a professional-grade DCF model for financial reporting and analysis related to (MRVI).
- Consultants: Easily customize the template for valuation reports tailored to clients in the life sciences sector.
- Entrepreneurs: Acquire knowledge on financial modeling techniques employed by leading biotech firms.
- Educators: Implement it as a teaching resource to illustrate valuation methodologies in the life sciences field.
What the Template Contains
- Pre-Filled DCF Model: Maravai LifeSciences Holdings, Inc. (MRVI)’s financial data preloaded for immediate use.
- WACC Calculator: Detailed calculations for Weighted Average Cost of Capital.
- Financial Ratios: Evaluate Maravai’s profitability, leverage, and efficiency.
- Editable Inputs: Change assumptions such as growth, margins, and CAPEX to fit your scenarios.
- Financial Statements: Annual and quarterly reports to support detailed analysis.
- Interactive Dashboard: Easily visualize key valuation metrics and results.
Disclaimer
All information, articles, and product details provided on this website are for general informational and educational purposes only. We do not claim any ownership over, nor do we intend to infringe upon, any trademarks, copyrights, logos, brand names, or other intellectual property mentioned or depicted on this site. Such intellectual property remains the property of its respective owners, and any references here are made solely for identification or informational purposes, without implying any affiliation, endorsement, or partnership.
We make no representations or warranties, express or implied, regarding the accuracy, completeness, or suitability of any content or products presented. Nothing on this website should be construed as legal, tax, investment, financial, medical, or other professional advice. In addition, no part of this site—including articles or product references—constitutes a solicitation, recommendation, endorsement, advertisement, or offer to buy or sell any securities, franchises, or other financial instruments, particularly in jurisdictions where such activity would be unlawful.
All content is of a general nature and may not address the specific circumstances of any individual or entity. It is not a substitute for professional advice or services. Any actions you take based on the information provided here are strictly at your own risk. You accept full responsibility for any decisions or outcomes arising from your use of this website and agree to release us from any liability in connection with your use of, or reliance upon, the content or products found herein.