
|
Morgan Stanley (MS) DCF -Bewertung |
Fully Editable: Tailor To Your Needs In Excel Or Sheets
Professional Design: Trusted, Industry-Standard Templates
Investor-Approved Valuation Models
MAC/PC Compatible, Fully Unlocked
No Expertise Is Needed; Easy To Follow
Morgan Stanley (MS) Bundle
Mit unserem DCF-Taschenrechner von Morgan Stanley (MS), der für die Genauigkeit entwickelt wurde, können Sie die Bewertung von Morgan Stanley anhand von Finanzdaten mit realer Welt bewerten und vollständige Flexibilität bieten, um alle wesentlichen Parameter für erweiterte Projektionen zu ändern.
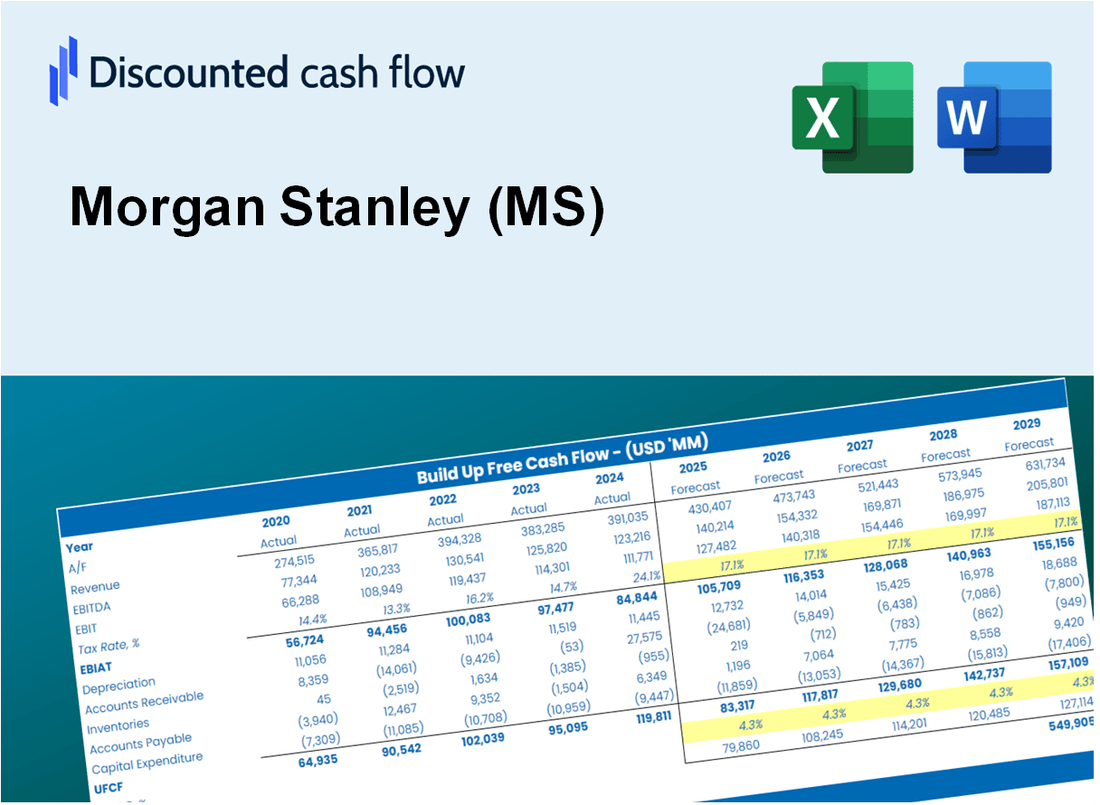
Discounted Cash Flow (DCF) - (USD MM)
| Year | AY1 2020 |
AY2 2021 |
AY3 2022 |
AY4 2023 |
AY5 2024 |
FY1 2025 |
FY2 2026 |
FY3 2027 |
FY4 2028 |
FY5 2029 |
|---|---|---|---|---|---|---|---|---|---|---|
| Revenue | 49,677.0 | 57,780.0 | 62,478.0 | 88,286.0 | 103,145.0 | 124,439.3 | 150,129.8 | 181,124.2 | 218,517.3 | 263,630.2 |
| Revenue Growth, % | 0 | 16.31 | 8.13 | 41.31 | 16.83 | 20.65 | 20.65 | 20.65 | 20.65 | 20.65 |
| EBITDA | 18,187.0 | 23,884.0 | 18,087.0 | 16,069.0 | 22,757.0 | 36,625.0 | 44,186.3 | 53,308.5 | 64,314.1 | 77,591.7 |
| EBITDA, % | 36.61 | 41.34 | 28.95 | 18.2 | 22.06 | 29.43 | 29.43 | 29.43 | 29.43 | 29.43 |
| Depreciation | 3,769.0 | 4,216.0 | 3,998.0 | 4,256.0 | 5,161.0 | 7,741.9 | 9,340.2 | 11,268.5 | 13,594.9 | 16,401.5 |
| Depreciation, % | 7.59 | 7.3 | 6.4 | 4.82 | 5 | 6.22 | 6.22 | 6.22 | 6.22 | 6.22 |
| EBIT | 14,418.0 | 19,668.0 | 14,089.0 | 11,813.0 | 17,596.0 | 28,883.1 | 34,846.1 | 42,040.1 | 50,719.2 | 61,190.2 |
| EBIT, % | 29.02 | 34.04 | 22.55 | 13.38 | 17.06 | 23.21 | 23.21 | 23.21 | 23.21 | 23.21 |
| Total Cash | 474,229.0 | 500,350.0 | 467,855.0 | 461,890.0 | 401,589.0 | 124,439.3 | 150,129.8 | 181,124.2 | 218,517.3 | 263,630.2 |
| Total Cash, percent | .0 | .0 | .0 | .0 | .0 | .0 | .0 | .0 | .0 | .0 |
| Account Receivables | 97,737.0 | 96,018.0 | 78,540.0 | 80,105.0 | 86,158.0 | 118,034.3 | 142,402.5 | 171,801.5 | 207,270.0 | 250,060.9 |
| Account Receivables, % | 196.74 | 166.18 | 125.71 | 90.73 | 83.53 | 94.85 | 94.85 | 94.85 | 94.85 | 94.85 |
| Inventories | .0 | .0 | .0 | .0 | .0 | .0 | .0 | .0 | .0 | .0 |
| Inventories, % | 0 | 0 | 0 | 0 | 0 | 0 | 0 | 0 | 0 | 0 |
| Accounts Payable | 227,437.0 | 228,685.0 | 216,134.0 | 208,148.0 | 175,938.0 | 124,439.3 | 150,129.8 | 181,124.2 | 218,517.3 | 263,630.2 |
| Accounts Payable, % | 457.83 | 395.79 | 345.94 | 235.77 | 170.57 | 100 | 100 | 100 | 100 | 100 |
| Capital Expenditure | -1,444.0 | -2,308.0 | -3,078.0 | -3,412.0 | -3,462.0 | -4,740.9 | -5,719.6 | -6,900.4 | -8,325.0 | -10,043.7 |
| Capital Expenditure, % | -2.91 | -3.99 | -4.93 | -3.86 | -3.36 | -3.81 | -3.81 | -3.81 | -3.81 | -3.81 |
| Tax Rate, % | 23.9 | 23.9 | 23.9 | 23.9 | 23.9 | 23.9 | 23.9 | 23.9 | 23.9 | 23.9 |
| EBITAT | 10,996.0 | 15,034.0 | 11,029.0 | 9,087.0 | 13,390.0 | 22,182.6 | 26,762.2 | 32,287.3 | 38,953.0 | 46,994.9 |
| Depreciation | ||||||||||
| Changes in Account Receivables | ||||||||||
| Changes in Inventories | ||||||||||
| Changes in Accounts Payable | ||||||||||
| Capital Expenditure | ||||||||||
| UFCF | 143,021.0 | 19,909.0 | 16,876.0 | 380.0 | -23,174.0 | -58,191.4 | 31,705.1 | 38,250.6 | 46,147.5 | 55,674.6 |
| WACC, % | 9.57 | 9.58 | 9.72 | 9.62 | 9.56 | 9.61 | 9.61 | 9.61 | 9.61 | 9.61 |
| PV UFCF | ||||||||||
| SUM PV UFCF | 69,512.1 | |||||||||
| Long Term Growth Rate, % | 2.00 | |||||||||
| Free cash flow (T + 1) | 56,788 | |||||||||
| Terminal Value | 746,417 | |||||||||
| Present Terminal Value | 471,811 | |||||||||
| Enterprise Value | 541,323 | |||||||||
| Net Debt | 284,745 | |||||||||
| Equity Value | 256,578 | |||||||||
| Diluted Shares Outstanding, MM | 1,611 | |||||||||
| Equity Value Per Share | 159.27 |
What You Will Get
- Real Morgan Stanley Data: Preloaded financials – from revenue to EBIT – based on actual and projected figures.
- Full Customization: Adjust all critical parameters (yellow cells) like WACC, growth %, and tax rates.
- Instant Valuation Updates: Automatic recalculations to analyze the impact of changes on Morgan Stanley’s fair value.
- Versatile Excel Template: Tailored for quick edits, scenario testing, and detailed projections.
- Time-Saving and Accurate: Skip building models from scratch while maintaining precision and flexibility.
Key Features
- Comprehensive MS Data: Pre-filled with Morgan Stanley’s historical financials and future projections.
- Fully Customizable Inputs: Modify revenue growth, profit margins, WACC, tax rates, and capital expenditures as needed.
- Dynamic Valuation Model: Automatic recalculations of Net Present Value (NPV) and intrinsic value based on your adjustments.
- Scenario Testing: Develop various forecast scenarios to explore different valuation results.
- User-Friendly Design: Intuitive layout that caters to both professionals and novices.
How It Works
- Download the Template: Gain immediate access to the Excel-based MS DCF Calculator.
- Input Your Assumptions: Modify the yellow-highlighted cells for growth rates, WACC, margins, and other variables.
- Instant Calculations: The model automatically recalculates Morgan Stanley’s intrinsic value.
- Test Scenarios: Experiment with various assumptions to assess potential valuation shifts.
- Analyze and Decide: Leverage the results to inform your investment or financial analysis.
Why Choose This Calculator?
- Comprehensive Tool: Integrates DCF, WACC, and financial ratio analyses all in one platform.
- Customizable Inputs: Modify yellow-highlighted cells to explore different financial scenarios.
- Detailed Insights: Automatically computes Morgan Stanley’s intrinsic value and Net Present Value.
- Preloaded Data: Historical and projected data provide reliable starting points for analysis.
- Professional Quality: Perfect for financial analysts, investors, and business consultants.
Who Should Use This Product?
- Individual Investors: Make informed decisions about buying or selling Morgan Stanley (MS) stock.
- Financial Analysts: Enhance valuation processes with comprehensive financial models tailored for Morgan Stanley (MS).
- Consultants: Provide clients with expert valuation insights on Morgan Stanley (MS) efficiently and effectively.
- Business Owners: Gain insights into how major firms like Morgan Stanley (MS) are valued to inform your strategic planning.
- Finance Students: Explore valuation methodologies using real-world data related to Morgan Stanley (MS).
What the Template Contains
- Pre-Filled Data: Includes Morgan Stanley's historical financials and forecasts.
- Discounted Cash Flow Model: Editable DCF valuation model with automatic calculations.
- Weighted Average Cost of Capital (WACC): A dedicated sheet for calculating WACC based on custom inputs.
- Key Financial Ratios: Analyze Morgan Stanley's profitability, efficiency, and leverage.
- Customizable Inputs: Edit revenue growth, margins, and tax rates with ease.
- Clear Dashboard: Charts and tables summarizing key valuation results.
Disclaimer
All information, articles, and product details provided on this website are for general informational and educational purposes only. We do not claim any ownership over, nor do we intend to infringe upon, any trademarks, copyrights, logos, brand names, or other intellectual property mentioned or depicted on this site. Such intellectual property remains the property of its respective owners, and any references here are made solely for identification or informational purposes, without implying any affiliation, endorsement, or partnership.
We make no representations or warranties, express or implied, regarding the accuracy, completeness, or suitability of any content or products presented. Nothing on this website should be construed as legal, tax, investment, financial, medical, or other professional advice. In addition, no part of this site—including articles or product references—constitutes a solicitation, recommendation, endorsement, advertisement, or offer to buy or sell any securities, franchises, or other financial instruments, particularly in jurisdictions where such activity would be unlawful.
All content is of a general nature and may not address the specific circumstances of any individual or entity. It is not a substitute for professional advice or services. Any actions you take based on the information provided here are strictly at your own risk. You accept full responsibility for any decisions or outcomes arising from your use of this website and agree to release us from any liability in connection with your use of, or reliance upon, the content or products found herein.