
|
MSA Safety Incorporated (MSA) DCF -Bewertung |
Fully Editable: Tailor To Your Needs In Excel Or Sheets
Professional Design: Trusted, Industry-Standard Templates
Investor-Approved Valuation Models
MAC/PC Compatible, Fully Unlocked
No Expertise Is Needed; Easy To Follow
MSA Safety Incorporated (MSA) Bundle
Entdecken Sie den tatsächlichen Wert von MSA Safety Incorporated (MSA) mit unserem DCF-Taschenrechner von Professional Grade! Passen Sie die wichtigsten Annahmen an, erkunden Sie verschiedene Szenarien und bewerten Sie die Auswirkungen von Änderungen auf die Bewertung von MSA - alles innerhalb einer bequemen Excel -Vorlage.
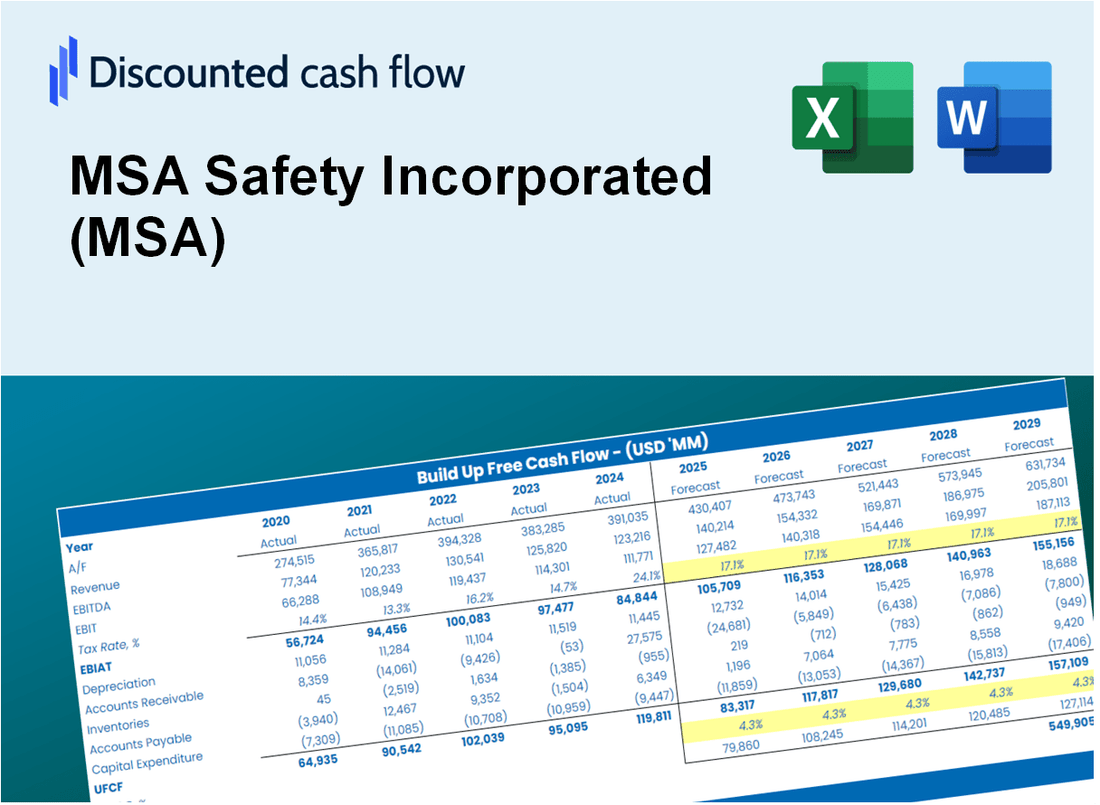
Discounted Cash Flow (DCF) - (USD MM)
| Year | AY1 2020 |
AY2 2021 |
AY3 2022 |
AY4 2023 |
AY5 2024 |
FY1 2025 |
FY2 2026 |
FY3 2027 |
FY4 2028 |
FY5 2029 |
|---|---|---|---|---|---|---|---|---|---|---|
| Revenue | 1,348.2 | 1,400.2 | 1,528.0 | 1,787.6 | 1,808.1 | 1,948.8 | 2,100.4 | 2,263.9 | 2,440.0 | 2,629.9 |
| Revenue Growth, % | 0 | 3.85 | 9.13 | 17 | 1.15 | 7.78 | 7.78 | 7.78 | 7.78 | 7.78 |
| EBITDA | 217.3 | 84.7 | 316.5 | 314.2 | 476.2 | 338.3 | 364.6 | 393.0 | 423.5 | 456.5 |
| EBITDA, % | 16.11 | 6.05 | 20.71 | 17.58 | 26.34 | 17.36 | 17.36 | 17.36 | 17.36 | 17.36 |
| Depreciation | 39.7 | 50.3 | 56.3 | 60.8 | 64.3 | 67.0 | 72.2 | 77.8 | 83.8 | 90.4 |
| Depreciation, % | 2.94 | 3.59 | 3.69 | 3.4 | 3.56 | 3.44 | 3.44 | 3.44 | 3.44 | 3.44 |
| EBIT | 177.6 | 34.4 | 260.2 | 253.4 | 411.9 | 271.3 | 292.4 | 315.2 | 339.7 | 366.1 |
| EBIT, % | 13.17 | 2.45 | 17.03 | 14.18 | 22.78 | 13.92 | 13.92 | 13.92 | 13.92 | 13.92 |
| Total Cash | 160.7 | 140.9 | 162.9 | 146.4 | 164.6 | 194.6 | 209.8 | 226.1 | 243.7 | 262.6 |
| Total Cash, percent | .0 | .0 | .0 | .0 | .0 | .0 | .0 | .0 | .0 | .0 |
| Account Receivables | 256.1 | 258.1 | 303.0 | 294.7 | 279.2 | 347.6 | 374.6 | 403.8 | 435.2 | 469.1 |
| Account Receivables, % | 18.99 | 18.43 | 19.83 | 16.48 | 15.44 | 17.84 | 17.84 | 17.84 | 17.84 | 17.84 |
| Inventories | 197.8 | 280.6 | 338.3 | 292.6 | 296.8 | 349.4 | 376.6 | 405.9 | 437.4 | 471.5 |
| Inventories, % | 14.67 | 20.04 | 22.14 | 16.37 | 16.41 | 17.93 | 17.93 | 17.93 | 17.93 | 17.93 |
| Accounts Payable | 86.9 | 106.8 | 112.5 | 111.9 | 108.2 | 131.2 | 141.5 | 152.5 | 164.3 | 177.1 |
| Accounts Payable, % | 6.44 | 7.63 | 7.36 | 6.26 | 5.98 | 6.73 | 6.73 | 6.73 | 6.73 | 6.73 |
| Capital Expenditure | -48.9 | -49.1 | -43.9 | -42.8 | -54.2 | -60.0 | -64.7 | -69.7 | -75.2 | -81.0 |
| Capital Expenditure, % | -3.63 | -3.51 | -2.88 | -2.39 | -3 | -3.08 | -3.08 | -3.08 | -3.08 | -3.08 |
| Tax Rate, % | 24.01 | 24.01 | 24.01 | 24.01 | 24.01 | 24.01 | 24.01 | 24.01 | 24.01 | 24.01 |
| EBITAT | 135.1 | 31.1 | 195.9 | 71.8 | 313.0 | 187.8 | 202.4 | 218.2 | 235.2 | 253.5 |
| Depreciation | ||||||||||
| Changes in Account Receivables | ||||||||||
| Changes in Inventories | ||||||||||
| Changes in Accounts Payable | ||||||||||
| Capital Expenditure | ||||||||||
| UFCF | -241.2 | -32.6 | 111.5 | 143.2 | 330.7 | 96.9 | 165.9 | 178.8 | 192.7 | 207.7 |
| WACC, % | 8 | 8.07 | 8 | 7.75 | 8 | 7.96 | 7.96 | 7.96 | 7.96 | 7.96 |
| PV UFCF | ||||||||||
| SUM PV UFCF | 657.5 | |||||||||
| Long Term Growth Rate, % | 4.00 | |||||||||
| Free cash flow (T + 1) | 216 | |||||||||
| Terminal Value | 5,449 | |||||||||
| Present Terminal Value | 3,715 | |||||||||
| Enterprise Value | 4,372 | |||||||||
| Net Debt | 401 | |||||||||
| Equity Value | 3,971 | |||||||||
| Diluted Shares Outstanding, MM | 40 | |||||||||
| Equity Value Per Share | 100.45 |
What You Will Get
- Pre-Filled Financial Model: MSA Safety Incorporated’s (MSA) actual data allows for accurate DCF valuation.
- Full Forecast Control: Modify revenue growth, profit margins, WACC, and other essential factors.
- Instant Calculations: Automatic updates provide real-time results as adjustments are made.
- Investor-Ready Template: A polished Excel file crafted for top-tier valuation purposes.
- Customizable and Reusable: Designed for adaptability, enabling repeated application for comprehensive forecasts.
Key Features
- Accurate MSA Financials: Gain access to reliable pre-loaded historical data and future forecasts.
- Customizable Valuation Assumptions: Modify highlighted cells for metrics like WACC, growth rates, and profit margins.
- Real-Time Calculations: Automatic adjustments to DCF, Net Present Value (NPV), and cash flow assessments.
- Interactive Dashboard: User-friendly charts and summaries for clear visualization of your valuation findings.
- Designed for All Levels: An intuitive layout tailored for investors, CFOs, and consultants alike.
How It Works
- Step 1: Download the Excel file.
- Step 2: Review pre-entered MSA data (historical and projected).
- Step 3: Adjust key assumptions (yellow cells) based on your analysis.
- Step 4: View automatic recalculations for MSA’s intrinsic value.
- Step 5: Use the outputs for investment decisions or reporting.
Why Choose This Calculator for MSA Safety Incorporated (MSA)?
- All-in-One Solution: Combines DCF, WACC, and financial ratio analyses tailored for MSA.
- Flexible Inputs: Modify yellow-highlighted fields to explore different financial scenarios.
- In-Depth Analysis: Automatically computes MSA’s intrinsic value and Net Present Value.
- Preloaded Information: Historical and projected data provide reliable starting points for analysis.
- Expert-Level Tool: Perfect for financial analysts, investors, and business consultants focusing on MSA.
Who Should Use This Product?
- Investors: Assess MSA Safety Incorporated’s (MSA) fair value to inform investment choices.
- CFOs: Utilize a sophisticated DCF model for accurate financial reporting and analysis.
- Consultants: Easily customize the template for client valuation reports.
- Entrepreneurs: Discover financial modeling strategies employed by leading safety companies.
- Educators: Employ it as an educational resource to illustrate valuation techniques.
What the Template Contains
- Pre-Filled DCF Model: MSA Safety Incorporated’s (MSA) financial data preloaded for immediate use.
- WACC Calculator: Detailed calculations for Weighted Average Cost of Capital.
- Financial Ratios: Evaluate MSA’s profitability, leverage, and efficiency.
- Editable Inputs: Change assumptions such as growth, margins, and CAPEX to fit your scenarios.
- Financial Statements: Annual and quarterly reports to support detailed analysis.
- Interactive Dashboard: Easily visualize key valuation metrics and results.
Disclaimer
All information, articles, and product details provided on this website are for general informational and educational purposes only. We do not claim any ownership over, nor do we intend to infringe upon, any trademarks, copyrights, logos, brand names, or other intellectual property mentioned or depicted on this site. Such intellectual property remains the property of its respective owners, and any references here are made solely for identification or informational purposes, without implying any affiliation, endorsement, or partnership.
We make no representations or warranties, express or implied, regarding the accuracy, completeness, or suitability of any content or products presented. Nothing on this website should be construed as legal, tax, investment, financial, medical, or other professional advice. In addition, no part of this site—including articles or product references—constitutes a solicitation, recommendation, endorsement, advertisement, or offer to buy or sell any securities, franchises, or other financial instruments, particularly in jurisdictions where such activity would be unlawful.
All content is of a general nature and may not address the specific circumstances of any individual or entity. It is not a substitute for professional advice or services. Any actions you take based on the information provided here are strictly at your own risk. You accept full responsibility for any decisions or outcomes arising from your use of this website and agree to release us from any liability in connection with your use of, or reliance upon, the content or products found herein.