
|
Microsoft Corporation (MSFT) DCF -Bewertung |
Fully Editable: Tailor To Your Needs In Excel Or Sheets
Professional Design: Trusted, Industry-Standard Templates
Investor-Approved Valuation Models
MAC/PC Compatible, Fully Unlocked
No Expertise Is Needed; Easy To Follow
Microsoft Corporation (MSFT) Bundle
Mit unserem DCF-Taschenrechner von Microsoft Corporation (MSFT) für Genauigkeit können Sie die Bewertung der Microsoft Corporation anhand von Finanzdaten mit realen Welt bewerten und vollständige Flexibilität bieten, um alle wesentlichen Parameter für erweiterte Projektionen zu ändern.
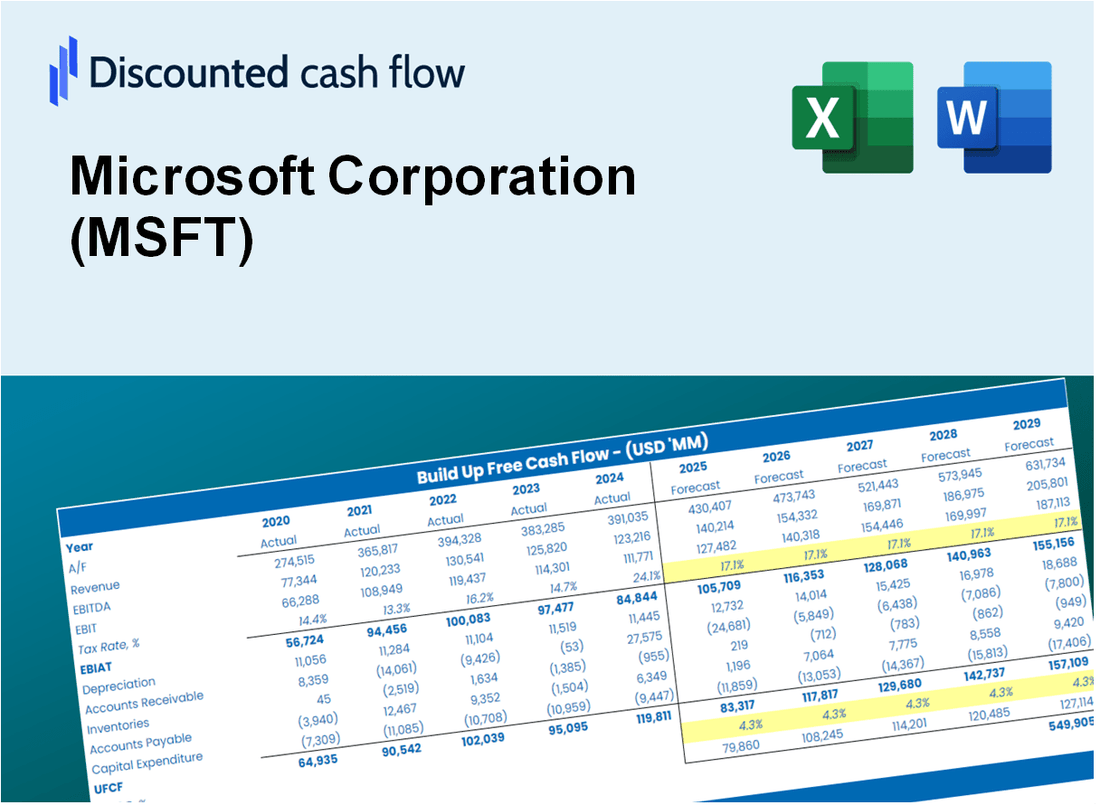
Discounted Cash Flow (DCF) - (USD MM)
| Year | AY1 2021 |
AY2 2022 |
AY3 2023 |
AY4 2024 |
AY5 2025 |
FY1 2026 |
FY2 2027 |
FY3 2028 |
FY4 2029 |
FY5 2030 |
|---|---|---|---|---|---|---|---|---|---|---|
| Revenue | 168,088.0 | 198,270.0 | 211,915.0 | 245,122.0 | 281,724.0 | 320,771.1 | 365,230.1 | 415,851.2 | 473,488.5 | 539,114.2 |
| Revenue Growth, % | 0 | 17.96 | 6.88 | 15.67 | 14.93 | 13.86 | 13.86 | 13.86 | 13.86 | 13.86 |
| EBITDA | 85,134.0 | 100,239.0 | 105,140.0 | 133,009.0 | 160,165.0 | 168,041.5 | 191,332.1 | 217,850.9 | 248,045.1 | 282,424.3 |
| EBITDA, % | 50.65 | 50.56 | 49.61 | 54.26 | 56.85 | 52.39 | 52.39 | 52.39 | 52.39 | 52.39 |
| Depreciation | 11,686.0 | 14,460.0 | 13,861.0 | 22,287.0 | 34,153.0 | 26,945.6 | 30,680.3 | 34,932.6 | 39,774.3 | 45,287.0 |
| Depreciation, % | 6.95 | 7.29 | 6.54 | 9.09 | 12.12 | 8.4 | 8.4 | 8.4 | 8.4 | 8.4 |
| EBIT | 73,448.0 | 85,779.0 | 91,279.0 | 110,722.0 | 126,012.0 | 141,095.9 | 160,651.8 | 182,918.3 | 208,270.8 | 237,137.3 |
| EBIT, % | 43.7 | 43.26 | 43.07 | 45.17 | 44.73 | 43.99 | 43.99 | 43.99 | 43.99 | 43.99 |
| Total Cash | 130,256.0 | 104,749.0 | 111,256.0 | 75,531.0 | 94,565.0 | 158,592.3 | 180,573.2 | 205,600.8 | 234,097.1 | 266,543.1 |
| Total Cash, percent | .0 | .0 | .0 | .0 | .0 | .0 | .0 | .0 | .0 | .0 |
| Account Receivables | 38,043.0 | 44,261.0 | 48,688.0 | 56,924.0 | 69,905.0 | 74,398.1 | 84,709.8 | 96,450.6 | 109,818.7 | 125,039.6 |
| Account Receivables, % | 22.63 | 22.32 | 22.98 | 23.22 | 24.81 | 23.19 | 23.19 | 23.19 | 23.19 | 23.19 |
| Inventories | 2,636.0 | 3,742.0 | 2,500.0 | 1,246.0 | 938.0 | 3,513.4 | 4,000.4 | 4,554.9 | 5,186.2 | 5,905.0 |
| Inventories, % | 1.57 | 1.89 | 1.18 | 0.50832 | 0.33295 | 1.1 | 1.1 | 1.1 | 1.1 | 1.1 |
| Accounts Payable | 15,163.0 | 19,000.0 | 18,095.0 | 21,996.0 | 27,724.0 | 29,483.3 | 33,569.7 | 38,222.5 | 43,520.1 | 49,552.0 |
| Accounts Payable, % | 9.02 | 9.58 | 8.54 | 8.97 | 9.84 | 9.19 | 9.19 | 9.19 | 9.19 | 9.19 |
| Capital Expenditure | -20,622.0 | -23,886.0 | -28,107.0 | -44,477.0 | -64,551.0 | -50,448.8 | -57,441.1 | -65,402.4 | -74,467.2 | -84,788.4 |
| Capital Expenditure, % | -12.27 | -12.05 | -13.26 | -18.14 | -22.91 | -15.73 | -15.73 | -15.73 | -15.73 | -15.73 |
| Tax Rate, % | 17.63 | 17.63 | 17.63 | 17.63 | 17.63 | 17.63 | 17.63 | 17.63 | 17.63 | 17.63 |
| EBITAT | 63,292.6 | 74,530.5 | 73,955.5 | 90,535.9 | 103,796.5 | 118,018.3 | 134,375.8 | 153,000.3 | 174,206.2 | 198,351.3 |
| Depreciation | ||||||||||
| Changes in Account Receivables | ||||||||||
| Changes in Inventories | ||||||||||
| Changes in Accounts Payable | ||||||||||
| Capital Expenditure | ||||||||||
| UFCF | 28,840.6 | 61,617.5 | 55,619.5 | 65,264.9 | 66,453.5 | 89,205.8 | 100,902.8 | 114,888.0 | 130,811.5 | 148,942.0 |
| WACC, % | 8.46 | 8.46 | 8.46 | 8.46 | 8.46 | 8.46 | 8.46 | 8.46 | 8.46 | 8.46 |
| PV UFCF | ||||||||||
| SUM PV UFCF | 451,866.0 | |||||||||
| Long Term Growth Rate, % | 4.00 | |||||||||
| Free cash flow (T + 1) | 154,900 | |||||||||
| Terminal Value | 3,474,956 | |||||||||
| Present Terminal Value | 2,315,524 | |||||||||
| Enterprise Value | 2,767,390 | |||||||||
| Net Debt | 30,346 | |||||||||
| Equity Value | 2,737,044 | |||||||||
| Diluted Shares Outstanding, MM | 7,465 | |||||||||
| Equity Value Per Share | 366.65 |
What You Will Get
- Real MSFT Financials: Access to historical and projected data for precise valuation.
- Customizable Inputs: Adjust WACC, tax rates, revenue growth, and capital expenditures as needed.
- Automated Calculations: Intrinsic value and NPV are computed in real-time.
- Scenario Analysis: Evaluate various scenarios to assess Microsoft’s future performance.
- User-Friendly Design: Designed for professionals while remaining easy to use for newcomers.
Key Features
- 🔍 Real-Life MSFT Financials: Pre-filled historical and projected data for Microsoft Corporation (MSFT).
- ✏️ Fully Customizable Inputs: Adjust all critical parameters (yellow cells) like WACC, growth %, and tax rates.
- 📊 Professional DCF Valuation: Built-in formulas calculate Microsoft’s intrinsic value using the Discounted Cash Flow method.
- ⚡ Instant Results: Visualize Microsoft’s valuation instantly after making changes.
- Scenario Analysis: Test and compare outcomes for various financial assumptions side-by-side.
How It Works
- 1. Access the Template: Download and open the Excel file featuring Microsoft Corporation’s (MSFT) preloaded data.
- 2. Modify Assumptions: Adjust key inputs such as growth rates, WACC, and capital expenditures.
- 3. View Results Instantly: The DCF model automatically computes intrinsic value and NPV.
- 4. Explore Scenarios: Compare various forecasts to evaluate different valuation outcomes.
- 5. Utilize with Assurance: Present expert valuation insights to bolster your decision-making.
Why Choose This Calculator?
- Designed for Experts: A sophisticated tool utilized by analysts, CFOs, and financial consultants.
- Accurate Financial Data: Microsoft’s historical and projected financials preloaded for precision.
- Flexible Scenario Analysis: Effortlessly simulate various forecasts and assumptions.
- Comprehensive Outputs: Automatically computes intrinsic value, NPV, and essential metrics.
- User-Friendly: Step-by-step guidance walks you through each stage of the process.
Who Should Use Microsoft Corporation (MSFT)?
- Investors: Enhance your investment strategy with insights from a leading tech giant.
- Financial Analysts: Leverage comprehensive financial data to conduct in-depth analysis.
- Consultants: Utilize Microsoft’s robust tools for client presentations and strategic recommendations.
- Tech Enthusiasts: Explore innovative solutions and technologies that drive the future of business.
- Educators and Students: Incorporate real-world case studies into finance and technology curricula.
What the Template Contains
- Preloaded MSFT Data: Historical and projected financial data, including revenue, EBIT, and capital expenditures.
- DCF and WACC Models: Professional-grade sheets for calculating intrinsic value and Weighted Average Cost of Capital.
- Editable Inputs: Yellow-highlighted cells for adjusting revenue growth, tax rates, and discount rates.
- Financial Statements: Comprehensive annual and quarterly financials for deeper analysis.
- Key Ratios: Profitability, leverage, and efficiency ratios to evaluate performance.
- Dashboard and Charts: Visual summaries of valuation outcomes and assumptions.
Disclaimer
All information, articles, and product details provided on this website are for general informational and educational purposes only. We do not claim any ownership over, nor do we intend to infringe upon, any trademarks, copyrights, logos, brand names, or other intellectual property mentioned or depicted on this site. Such intellectual property remains the property of its respective owners, and any references here are made solely for identification or informational purposes, without implying any affiliation, endorsement, or partnership.
We make no representations or warranties, express or implied, regarding the accuracy, completeness, or suitability of any content or products presented. Nothing on this website should be construed as legal, tax, investment, financial, medical, or other professional advice. In addition, no part of this site—including articles or product references—constitutes a solicitation, recommendation, endorsement, advertisement, or offer to buy or sell any securities, franchises, or other financial instruments, particularly in jurisdictions where such activity would be unlawful.
All content is of a general nature and may not address the specific circumstances of any individual or entity. It is not a substitute for professional advice or services. Any actions you take based on the information provided here are strictly at your own risk. You accept full responsibility for any decisions or outcomes arising from your use of this website and agree to release us from any liability in connection with your use of, or reliance upon, the content or products found herein.