
|
Madison Square Garden Entertainment Corp. (MSGE) DCF -Bewertung |
Fully Editable: Tailor To Your Needs In Excel Or Sheets
Professional Design: Trusted, Industry-Standard Templates
Investor-Approved Valuation Models
MAC/PC Compatible, Fully Unlocked
No Expertise Is Needed; Easy To Follow
Madison Square Garden Entertainment Corp. (MSGE) Bundle
Stürzen Sie Ihre Analyse und verbessern Sie die Präzision mit unserem [MSGE] DCF -Taschenrechner! Ausgestattet mit Daten und anpassbaren Annahmen von Real Madison Square Garden Entertainment Corp., befähigt dieses Tool Sie, Madison Square Garden Entertainment wie ein erfahrener Investor zu prognostizieren, zu analysieren und zu schätzen.
What You Will Get
- Real MSGE Financial Data: Pre-filled with Madison Square Garden Entertainment Corp.'s historical and projected data for precise analysis.
- Fully Editable Template: Modify key inputs like revenue growth, WACC, and EBITDA % with ease.
- Automatic Calculations: See MSGE’s intrinsic value update instantly based on your changes.
- Professional Valuation Tool: Designed for investors, analysts, and consultants seeking accurate DCF results.
- User-Friendly Design: Simple structure and clear instructions for all experience levels.
Key Features
- Real-Life MSGE Data: Pre-filled with Madison Square Garden Entertainment's historical financials and future projections.
- Fully Customizable Inputs: Modify revenue growth, margins, WACC, tax rates, and capital expenditures to fit your analysis.
- Dynamic Valuation Model: Automatic updates to Net Present Value (NPV) and intrinsic value based on your customized inputs.
- Scenario Testing: Generate multiple forecast scenarios to explore various valuation outcomes.
- User-Friendly Design: Intuitive, organized, and crafted for both professionals and novices.
How It Works
- Download: Access the ready-to-use Excel file with Madison Square Garden Entertainment Corp.'s (MSGE) financial data.
- Customize: Adjust forecasts, including revenue growth, EBITDA %, and WACC.
- Update Automatically: The intrinsic value and NPV calculations update in real-time.
- Test Scenarios: Create multiple projections and compare outcomes instantly.
- Make Decisions: Use the valuation results to guide your investment strategy.
Why Choose This Calculator?
- Accurate Data: Up-to-date Madison Square Garden Entertainment Corp. (MSGE) financials provide trustworthy valuation outcomes.
- Customizable: Modify essential parameters such as growth rates, WACC, and tax rates to align with your forecasts.
- Time-Saving: Pre-configured calculations save you the hassle of starting from scratch.
- Professional-Grade Tool: Tailored for investors, analysts, and consultants in the entertainment industry.
- User-Friendly: Simple design and step-by-step guidance make it accessible for all users.
Who Should Use This Product?
- Investors: Accurately assess Madison Square Garden Entertainment Corp.’s (MSGE) fair value prior to making investment choices.
- CFOs: Utilize a professional-grade DCF model for financial reporting and analysis specific to MSGE.
- Consultants: Easily customize the template for valuation reports tailored to MSGE clients.
- Entrepreneurs: Acquire insights into financial modeling practices employed by leading entertainment firms.
- Educators: Implement it as a teaching resource to illustrate valuation techniques relevant to MSGE.
What the Template Contains
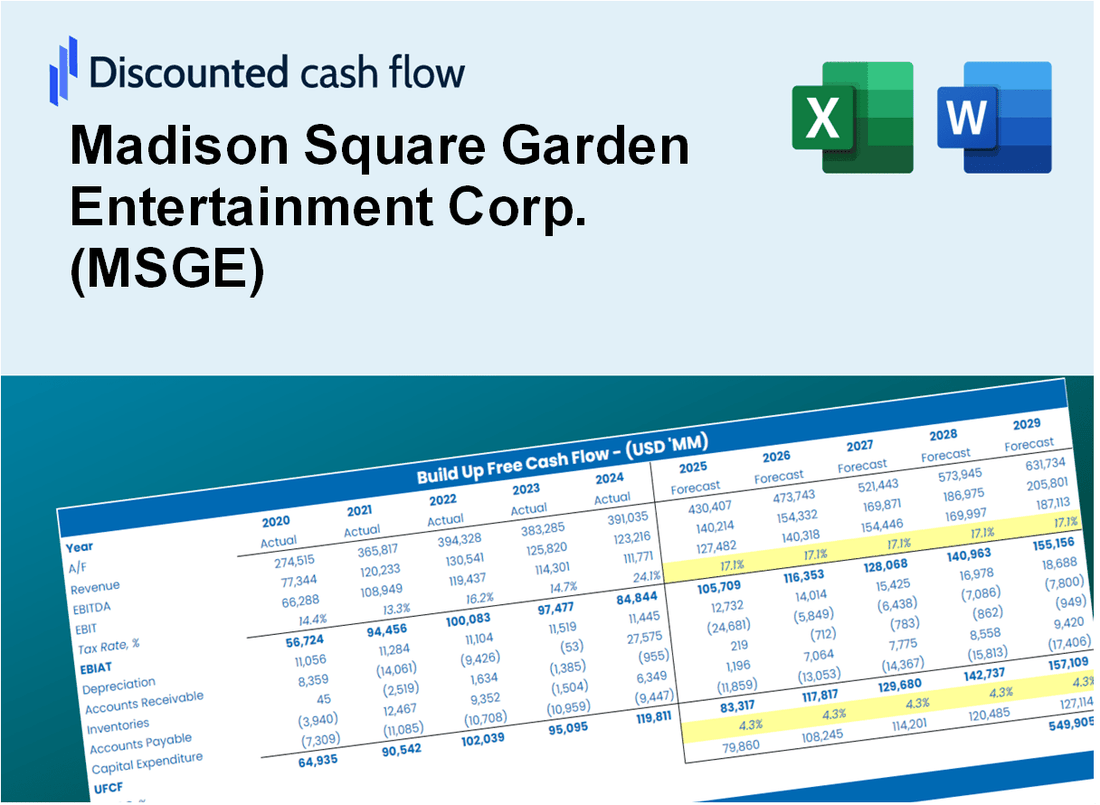
- Preloaded MSGE Data: Historical and projected financial data, including revenue, EBIT, and capital expenditures.
- DCF and WACC Models: Professional-grade sheets for calculating intrinsic value and Weighted Average Cost of Capital.
- Editable Inputs: Yellow-highlighted cells for adjusting revenue growth, tax rates, and discount rates.
- Financial Statements: Comprehensive annual and quarterly financials for deeper analysis.
- Key Ratios: Profitability, leverage, and efficiency ratios to evaluate performance.
- Dashboard and Charts: Visual summaries of valuation outcomes and assumptions.
Disclaimer
All information, articles, and product details provided on this website are for general informational and educational purposes only. We do not claim any ownership over, nor do we intend to infringe upon, any trademarks, copyrights, logos, brand names, or other intellectual property mentioned or depicted on this site. Such intellectual property remains the property of its respective owners, and any references here are made solely for identification or informational purposes, without implying any affiliation, endorsement, or partnership.
We make no representations or warranties, express or implied, regarding the accuracy, completeness, or suitability of any content or products presented. Nothing on this website should be construed as legal, tax, investment, financial, medical, or other professional advice. In addition, no part of this site—including articles or product references—constitutes a solicitation, recommendation, endorsement, advertisement, or offer to buy or sell any securities, franchises, or other financial instruments, particularly in jurisdictions where such activity would be unlawful.
All content is of a general nature and may not address the specific circumstances of any individual or entity. It is not a substitute for professional advice or services. Any actions you take based on the information provided here are strictly at your own risk. You accept full responsibility for any decisions or outcomes arising from your use of this website and agree to release us from any liability in connection with your use of, or reliance upon, the content or products found herein.