
|
Madison Square Garden Sports Corp. (MSGS) DCF -Bewertung |
Fully Editable: Tailor To Your Needs In Excel Or Sheets
Professional Design: Trusted, Industry-Standard Templates
Investor-Approved Valuation Models
MAC/PC Compatible, Fully Unlocked
No Expertise Is Needed; Easy To Follow
Madison Square Garden Sports Corp. (MSGS) Bundle
Unabhängig davon, ob Sie ein Investor oder ein Analyst sind, ist dieser (MSGS) DCF-Taschenrechner Ihre Anlaufstelle für eine genaue Bewertung. Mit echten Daten von Madison Square Garden Sports Corp. können Sie Prognosen anpassen und die Auswirkungen sofort beobachten.
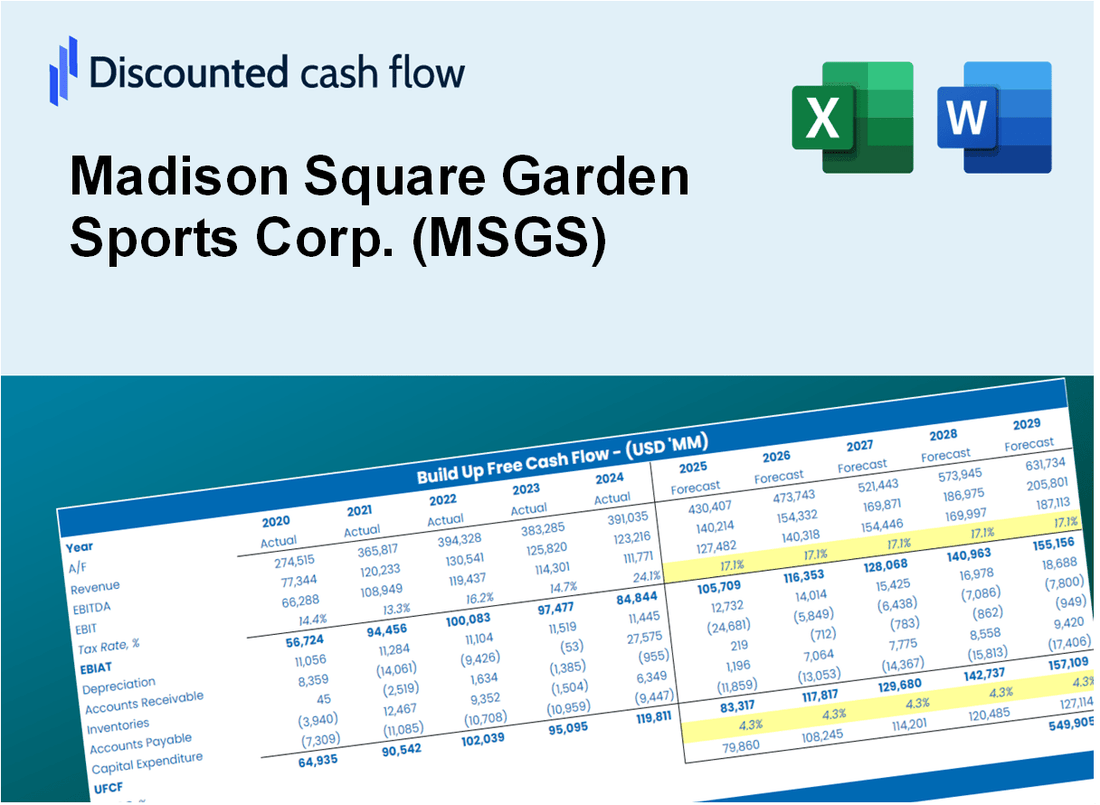
Discounted Cash Flow (DCF) - (USD MM)
| Year | AY1 2021 |
AY2 2022 |
AY3 2023 |
AY4 2024 |
AY5 2025 |
FY1 2026 |
FY2 2027 |
FY3 2028 |
FY4 2029 |
FY5 2030 |
|---|---|---|---|---|---|---|---|---|---|---|
| Revenue | 415.7 | 821.4 | 887.4 | 1,027.1 | 1,039.2 | 1,357.6 | 1,773.5 | 2,316.8 | 3,026.5 | 3,953.6 |
| Revenue Growth, % | 0 | 97.57 | 8.05 | 15.74 | 1.18 | 30.63 | 30.63 | 30.63 | 30.63 | 30.63 |
| EBITDA | -73.2 | 90.7 | 116.4 | 136.4 | 7.6 | 55.8 | 72.9 | 95.3 | 124.5 | 162.6 |
| EBITDA, % | -17.6 | 11.04 | 13.11 | 13.28 | 0.73113 | 4.11 | 4.11 | 4.11 | 4.11 | 4.11 |
| Depreciation | 5.6 | 5.0 | 3.6 | 3.2 | 3.2 | 8.1 | 10.6 | 13.8 | 18.0 | 23.5 |
| Depreciation, % | 1.34 | 0.61386 | 0.40307 | 0.30804 | 0.30966 | 0.59509 | 0.59509 | 0.59509 | 0.59509 | 0.59509 |
| EBIT | -78.8 | 85.7 | 112.8 | 133.3 | 4.4 | 47.8 | 62.4 | 81.5 | 106.5 | 139.1 |
| EBIT, % | -18.94 | 10.43 | 12.71 | 12.97 | 0.42147 | 3.52 | 3.52 | 3.52 | 3.52 | 3.52 |
| Total Cash | 72.0 | 91.0 | 40.5 | 94.9 | 153.2 | 154.6 | 202.0 | 263.9 | 344.7 | 450.3 |
| Total Cash, percent | .0 | .0 | .0 | .0 | .0 | .0 | .0 | .0 | .0 | .0 |
| Account Receivables | 90.2 | 89.4 | 75.6 | 80.1 | 43.5 | 144.1 | 188.3 | 246.0 | 321.4 | 419.8 |
| Account Receivables, % | 21.7 | 10.89 | 8.52 | 7.8 | 4.19 | 10.62 | 10.62 | 10.62 | 10.62 | 10.62 |
| Inventories | .0 | .0 | .0 | .0 | .0 | .0 | .0 | .0 | .0 | .0 |
| Inventories, % | 0 | 0 | 0 | 0 | 0 | 0 | 0 | 0 | 0 | 0 |
| Accounts Payable | 19.3 | 30.9 | 14.9 | 16.6 | 14.1 | 35.5 | 46.4 | 60.6 | 79.1 | 103.3 |
| Accounts Payable, % | 4.65 | 3.76 | 1.68 | 1.62 | 1.36 | 2.61 | 2.61 | 2.61 | 2.61 | 2.61 |
| Capital Expenditure | -.5 | -.9 | -1.2 | -1.5 | -3.6 | -2.3 | -3.0 | -3.9 | -5.1 | -6.7 |
| Capital Expenditure, % | -0.11209 | -0.11347 | -0.13308 | -0.14126 | -0.34843 | -0.16967 | -0.16967 | -0.16967 | -0.16967 | -0.16967 |
| Tax Rate, % | -29.91 | -29.91 | -29.91 | -29.91 | -29.91 | -29.91 | -29.91 | -29.91 | -29.91 | -29.91 |
| EBITAT | -12.3 | 59.2 | 60.0 | 74.1 | 5.7 | 28.0 | 36.6 | 47.9 | 62.5 | 81.7 |
| Depreciation | ||||||||||
| Changes in Account Receivables | ||||||||||
| Changes in Inventories | ||||||||||
| Changes in Accounts Payable | ||||||||||
| Capital Expenditure | ||||||||||
| UFCF | -78.1 | 75.7 | 60.2 | 73.0 | 39.4 | -45.5 | 10.9 | 14.2 | 18.6 | 24.3 |
| WACC, % | 5.61 | 5.98 | 5.87 | 5.89 | 6.2 | 5.91 | 5.91 | 5.91 | 5.91 | 5.91 |
| PV UFCF | ||||||||||
| SUM PV UFCF | 11.7 | |||||||||
| Long Term Growth Rate, % | 4.00 | |||||||||
| Free cash flow (T + 1) | 25 | |||||||||
| Terminal Value | 1,322 | |||||||||
| Present Terminal Value | 992 | |||||||||
| Enterprise Value | 1,003 | |||||||||
| Net Debt | 1,031 | |||||||||
| Equity Value | -28 | |||||||||
| Diluted Shares Outstanding, MM | 24 | |||||||||
| Equity Value Per Share | -1.16 |
What You Will Receive
- Pre-Filled Financial Model: Madison Square Garden Sports Corp.'s (MSGS) actual data allows for accurate DCF valuation.
- Comprehensive Forecast Control: Modify revenue growth, profit margins, WACC, and other essential drivers.
- Real-Time Calculations: Automatic updates provide immediate feedback as you make adjustments.
- Professional-Grade Template: A polished Excel file crafted for high-quality valuation.
- Flexible and Reusable: Designed for adaptability, enabling repeated use for in-depth forecasts.
Key Features
- Pre-Loaded Data: Madison Square Garden Sports Corp. (MSGS) historical financial statements and pre-filled forecasts.
- Fully Adjustable Inputs: Edit WACC, tax rates, revenue growth, and EBITDA margins.
- Instant Results: See Madison Square Garden Sports Corp. (MSGS) intrinsic value recalculate in real time.
- Clear Visual Outputs: Dashboard charts display valuation results and key metrics.
- Built for Accuracy: A professional tool for analysts, investors, and finance experts.
How It Works
- Download: Obtain the pre-built Excel file containing Madison Square Garden Sports Corp.'s (MSGS) financial data.
- Customize: Modify projections, including revenue growth, EBITDA %, and WACC as needed.
- Update Automatically: The intrinsic value and NPV calculations refresh in real-time.
- Test Scenarios: Develop various forecasts and evaluate outcomes immediately.
- Make Decisions: Utilize the valuation findings to inform your investment choices.
Why Choose This Calculator for Madison Square Garden Sports Corp. (MSGS)?
- All-in-One Solution: Features DCF, WACC, and a variety of financial ratio analyses tailored for MSGS.
- Flexible Inputs: Modify the highlighted cells to explore different financial scenarios.
- In-Depth Analysis: Automatically computes Madison Square Garden's intrinsic value and Net Present Value.
- Preloaded Information: Historical and projected data provide reliable starting metrics.
- Expert-Level Tool: Perfect for financial analysts, investors, and consultants focusing on MSGS.
Who Should Use This Product?
- Individual Investors: Make informed decisions about buying or selling Madison Square Garden Sports Corp. (MSGS) stock.
- Financial Analysts: Streamline valuation processes with ready-to-use financial models specific to the sports industry.
- Consultants: Deliver professional valuation insights on sports franchises to clients quickly and accurately.
- Business Owners: Understand how companies like Madison Square Garden Sports Corp. (MSGS) are valued to inform your own business strategy.
- Finance Students: Learn valuation techniques using real-world data and scenarios from the sports sector.
What the Template Contains
- Operating and Balance Sheet Data: Pre-filled Madison Square Garden Sports Corp. (MSGS) historical data and forecasts, including revenue, EBITDA, EBIT, and capital expenditures.
- WACC Calculation: A dedicated sheet for Weighted Average Cost of Capital (WACC), featuring parameters such as Beta, risk-free rate, and share price.
- DCF Valuation (Unlevered and Levered): Editable Discounted Cash Flow models illustrating intrinsic value with comprehensive calculations.
- Financial Statements: Pre-loaded financial statements (annual and quarterly) to facilitate analysis.
- Key Ratios: Includes profitability, leverage, and efficiency ratios for Madison Square Garden Sports Corp. (MSGS).
- Dashboard and Charts: Visual summary of valuation outputs and assumptions for easy result analysis.
Disclaimer
All information, articles, and product details provided on this website are for general informational and educational purposes only. We do not claim any ownership over, nor do we intend to infringe upon, any trademarks, copyrights, logos, brand names, or other intellectual property mentioned or depicted on this site. Such intellectual property remains the property of its respective owners, and any references here are made solely for identification or informational purposes, without implying any affiliation, endorsement, or partnership.
We make no representations or warranties, express or implied, regarding the accuracy, completeness, or suitability of any content or products presented. Nothing on this website should be construed as legal, tax, investment, financial, medical, or other professional advice. In addition, no part of this site—including articles or product references—constitutes a solicitation, recommendation, endorsement, advertisement, or offer to buy or sell any securities, franchises, or other financial instruments, particularly in jurisdictions where such activity would be unlawful.
All content is of a general nature and may not address the specific circumstances of any individual or entity. It is not a substitute for professional advice or services. Any actions you take based on the information provided here are strictly at your own risk. You accept full responsibility for any decisions or outcomes arising from your use of this website and agree to release us from any liability in connection with your use of, or reliance upon, the content or products found herein.