
|
Maxcyte, Inc. (MXCT) DCF -Bewertung |
Fully Editable: Tailor To Your Needs In Excel Or Sheets
Professional Design: Trusted, Industry-Standard Templates
Investor-Approved Valuation Models
MAC/PC Compatible, Fully Unlocked
No Expertise Is Needed; Easy To Follow
MaxCyte, Inc. (MXCT) Bundle
Entdecken Sie das wahre Potenzial von Maxcyte, Inc. (MXCT) mit unserem fortschrittlichen DCF -Taschenrechner! Passen Sie die wichtigsten Annahmen an, erkunden Sie verschiedene Szenarien und beurteilen Sie, wie unterschiedliche Variablen die Bewertung von Maxcyte beeinflussen - alles innerhalb einer umfassenden Excel -Vorlage.
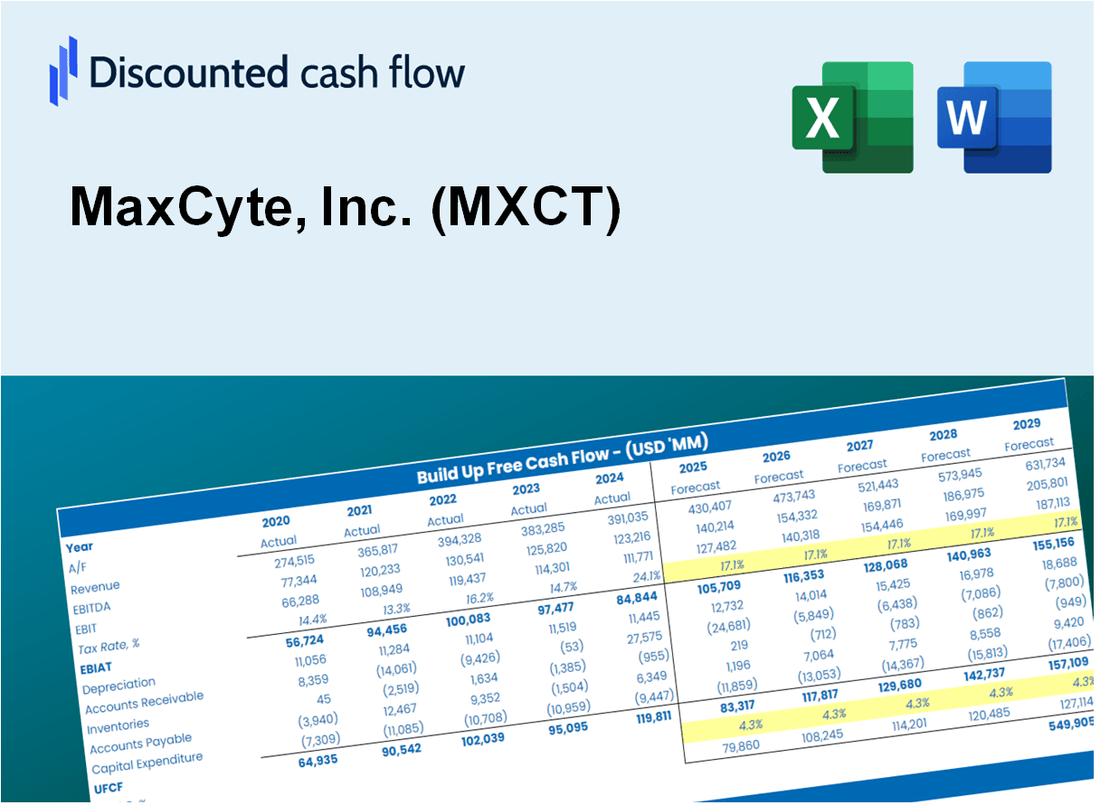
Discounted Cash Flow (DCF) - (USD MM)
| Year | AY1 2020 |
AY2 2021 |
AY3 2022 |
AY4 2023 |
AY5 2024 |
FY1 2025 |
FY2 2026 |
FY3 2027 |
FY4 2028 |
FY5 2029 |
|---|---|---|---|---|---|---|---|---|---|---|
| Revenue | 26.2 | 33.9 | 44.3 | 41.3 | 38.6 | 43.2 | 48.2 | 53.9 | 60.2 | 67.3 |
| Revenue Growth, % | 0 | 29.52 | 30.59 | -6.72 | -6.44 | 11.74 | 11.74 | 11.74 | 11.74 | 11.74 |
| EBITDA | -9.9 | -16.6 | -24.7 | -44.1 | -46.4 | -29.6 | -33.1 | -36.9 | -41.3 | -46.1 |
| EBITDA, % | -38 | -49.02 | -55.72 | -106.88 | -120.14 | -68.55 | -68.55 | -68.55 | -68.55 | -68.55 |
| Depreciation | 1.0 | 1.4 | 2.7 | 4.2 | 4.8 | 3.2 | 3.5 | 4.0 | 4.4 | 5.0 |
| Depreciation, % | 4 | 4.2 | 6.1 | 10.1 | 12.4 | 7.36 | 7.36 | 7.36 | 7.36 | 7.36 |
| EBIT | -11.0 | -18.0 | -27.4 | -48.3 | -51.2 | -30.8 | -34.4 | -38.5 | -43.0 | -48.0 |
| EBIT, % | -42 | -53.22 | -61.82 | -116.98 | -132.54 | -71.41 | -71.41 | -71.41 | -71.41 | -71.41 |
| Total Cash | 34.8 | 255.0 | 227.3 | 168.3 | 154.5 | 43.2 | 48.2 | 53.9 | 60.2 | 67.3 |
| Total Cash, percent | .0 | .0 | .0 | .0 | .0 | .0 | .0 | .0 | .0 | .0 |
| Account Receivables | 5.2 | 6.9 | 11.2 | 5.8 | 4.7 | 7.9 | 8.8 | 9.9 | 11.0 | 12.3 |
| Account Receivables, % | 19.76 | 20.29 | 25.25 | 13.99 | 12.12 | 18.28 | 18.28 | 18.28 | 18.28 | 18.28 |
| Inventories | 4.3 | 5.2 | 8.6 | 12.2 | 8.9 | 9.0 | 10.0 | 11.2 | 12.5 | 14.0 |
| Inventories, % | 16.49 | 15.36 | 19.39 | 29.62 | 23.08 | 20.79 | 20.79 | 20.79 | 20.79 | 20.79 |
| Accounts Payable | .9 | 1.8 | .3 | .7 | 1.4 | 1.3 | 1.4 | 1.6 | 1.8 | 2.0 |
| Accounts Payable, % | 3.4 | 5.37 | 0.65972 | 1.8 | 3.52 | 2.95 | 2.95 | 2.95 | 2.95 | 2.95 |
| Capital Expenditure | -2.1 | -3.8 | -18.5 | -3.7 | -1.7 | -6.4 | -7.2 | -8.0 | -8.9 | -10.0 |
| Capital Expenditure, % | -7.92 | -11.31 | -41.75 | -8.96 | -4.27 | -14.84 | -14.84 | -14.84 | -14.84 | -14.84 |
| Tax Rate, % | 0 | 0 | 0 | 0 | 0 | 0 | 0 | 0 | 0 | 0 |
| EBITAT | -11.0 | -18.0 | -27.4 | -48.3 | -51.2 | -30.8 | -34.4 | -38.5 | -43.0 | -48.0 |
| Depreciation | ||||||||||
| Changes in Account Receivables | ||||||||||
| Changes in Inventories | ||||||||||
| Changes in Accounts Payable | ||||||||||
| Capital Expenditure | ||||||||||
| UFCF | -20.6 | -22.1 | -52.3 | -45.6 | -43.0 | -37.4 | -39.9 | -44.6 | -49.8 | -55.6 |
| WACC, % | 5.13 | 5.13 | 5.13 | 5.13 | 5.13 | 5.13 | 5.13 | 5.13 | 5.13 | 5.13 |
| PV UFCF | ||||||||||
| SUM PV UFCF | -194.1 | |||||||||
| Long Term Growth Rate, % | 2.00 | |||||||||
| Free cash flow (T + 1) | -57 | |||||||||
| Terminal Value | -1,812 | |||||||||
| Present Terminal Value | -1,411 | |||||||||
| Enterprise Value | -1,605 | |||||||||
| Net Debt | -10 | |||||||||
| Equity Value | -1,595 | |||||||||
| Diluted Shares Outstanding, MM | 105 | |||||||||
| Equity Value Per Share | -15.21 |
What You Will Receive
- Pre-Filled Financial Model: MaxCyte’s actual data facilitates accurate DCF valuation.
- Comprehensive Forecast Control: Modify revenue growth, profit margins, WACC, and other essential metrics.
- Real-Time Calculations: Automatic updates provide immediate results as you adjust inputs.
- Professional-Grade Template: A polished Excel file crafted for high-quality valuation.
- Flexible and Reusable: Designed for adaptability, allowing for repeated use in detailed forecasting.
Key Features
- Comprehensive Financial Data: Gain access to precise historical performance and future forecasts for MaxCyte, Inc. (MXCT).
- Adjustable Forecast Parameters: Modify highlighted cells for key metrics like WACC, growth rates, and profit margins.
- Real-Time Calculations: Instant updates for DCF, Net Present Value (NPV), and cash flow assessments.
- User-Friendly Dashboard: Clear charts and summaries to help you interpret your valuation findings.
- Designed for All Skill Levels: A straightforward, intuitive layout tailored for investors, CFOs, and consultants alike.
How It Works
- Step 1: Download the Excel file.
- Step 2: Review pre-entered MaxCyte, Inc. (MXCT) data (historical and projected).
- Step 3: Adjust key assumptions (yellow cells) based on your analysis.
- Step 4: View automatic recalculations for MaxCyte, Inc. (MXCT)’s intrinsic value.
- Step 5: Use the outputs for investment decisions or reporting.
Why Choose This Calculator for MaxCyte, Inc. (MXCT)?
- Designed for Experts: A sophisticated tool tailored for analysts, CFOs, and industry consultants.
- Accurate Financial Data: MaxCyte's historical and projected financials are preloaded to ensure precision.
- Flexible Scenario Analysis: Effortlessly simulate various forecasts and assumptions.
- Comprehensive Outputs: Instantly calculates intrinsic value, NPV, and essential metrics.
- User-Friendly Interface: Step-by-step guidance simplifies the entire calculation process.
Who Should Use This Product?
- Investors: Accurately assess MaxCyte, Inc.'s (MXCT) fair value prior to making investment choices.
- CFOs: Utilize a professional-grade DCF model for financial reporting and analysis specific to MaxCyte, Inc. (MXCT).
- Consultants: Effortlessly modify the template for valuation reports tailored to MaxCyte, Inc. (MXCT) clients.
- Entrepreneurs: Acquire insights into financial modeling practices employed by leading biotech firms like MaxCyte, Inc. (MXCT).
- Educators: Implement it as a teaching resource to illustrate valuation techniques relevant to MaxCyte, Inc. (MXCT).
What the Template Contains
- Comprehensive DCF Model: Editable template featuring detailed valuation calculations tailored for MaxCyte, Inc. (MXCT).
- Real-World Data: MaxCyte's historical and projected financials preloaded for in-depth analysis.
- Customizable Parameters: Modify WACC, growth rates, and tax assumptions to explore various scenarios.
- Financial Statements: Complete annual and quarterly breakdowns for enhanced insights into MaxCyte's performance.
- Key Ratios: Integrated analysis for profitability, efficiency, and leverage specific to MaxCyte, Inc. (MXCT).
- Dashboard with Visual Outputs: Charts and tables providing clear, actionable results for stakeholders.
Disclaimer
All information, articles, and product details provided on this website are for general informational and educational purposes only. We do not claim any ownership over, nor do we intend to infringe upon, any trademarks, copyrights, logos, brand names, or other intellectual property mentioned or depicted on this site. Such intellectual property remains the property of its respective owners, and any references here are made solely for identification or informational purposes, without implying any affiliation, endorsement, or partnership.
We make no representations or warranties, express or implied, regarding the accuracy, completeness, or suitability of any content or products presented. Nothing on this website should be construed as legal, tax, investment, financial, medical, or other professional advice. In addition, no part of this site—including articles or product references—constitutes a solicitation, recommendation, endorsement, advertisement, or offer to buy or sell any securities, franchises, or other financial instruments, particularly in jurisdictions where such activity would be unlawful.
All content is of a general nature and may not address the specific circumstances of any individual or entity. It is not a substitute for professional advice or services. Any actions you take based on the information provided here are strictly at your own risk. You accept full responsibility for any decisions or outcomes arising from your use of this website and agree to release us from any liability in connection with your use of, or reliance upon, the content or products found herein.