
|
Newamsterdam Pharma Company N.V. (NAMSW) DCF -Bewertung |
Fully Editable: Tailor To Your Needs In Excel Or Sheets
Professional Design: Trusted, Industry-Standard Templates
Investor-Approved Valuation Models
MAC/PC Compatible, Fully Unlocked
No Expertise Is Needed; Easy To Follow
NewAmsterdam Pharma Company N.V. (NAMSW) Bundle
Stürzen Sie Ihre Analyse und verbessern Sie die Präzision mit unserem (NAMSW) DCF -Taschenrechner! Ausgestattet mit echten Daten von Newamsterdam Pharma Company N.V. und anpassbaren Annahmen ermöglicht es Ihnen, wie ein erfahrener Investor prognostiziert, bewertet und bewertet (NAMSW).
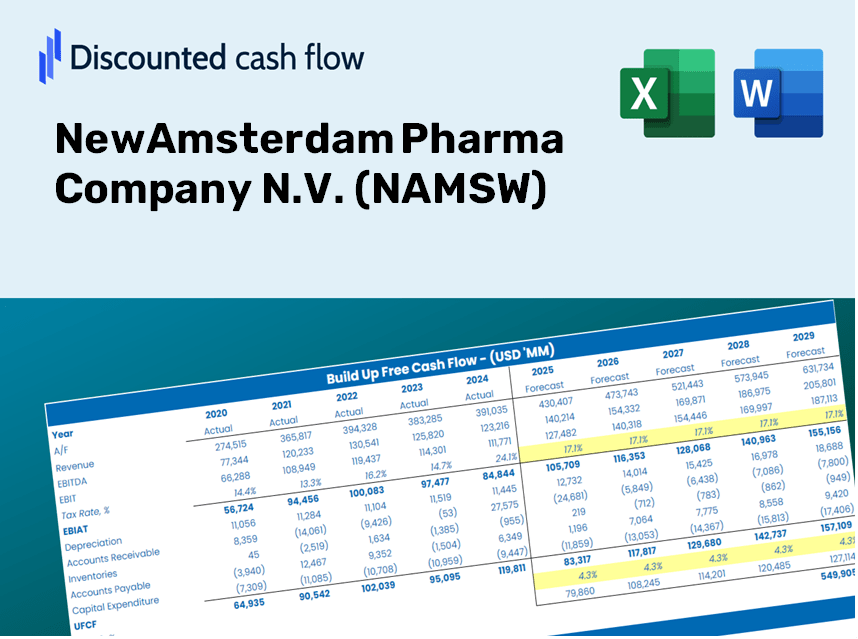
Discounted Cash Flow (DCF) - (USD MM)
| Year | AY1 2020 |
AY2 2021 |
AY3 2022 |
AY4 2023 |
AY5 2024 |
FY1 2025 |
FY2 2026 |
FY3 2027 |
FY4 2028 |
FY5 2029 |
|---|---|---|---|---|---|---|---|---|---|---|
| Revenue | .0 | .0 | 102.7 | 14.1 | 45.6 | 47.1 | 48.7 | 50.4 | 52.1 | 53.9 |
| Revenue Growth, % | 0 | 0 | 0 | -86.28 | 223.37 | 3.43 | 3.43 | 3.43 | 3.43 | 3.43 |
| EBITDA | -6.6 | -41.4 | -22.3 | -176.9 | -241.5 | -2.1 | -2.1 | -2.2 | -2.3 | -2.3 |
| EBITDA, % | 100 | 100 | -21.75 | -1255.22 | -530 | -4.35 | -4.35 | -4.35 | -4.35 | -4.35 |
| Depreciation | .0 | .0 | .0 | .0 | .1 | 18.9 | 19.6 | 20.2 | 20.9 | 21.6 |
| Depreciation, % | 100 | 100 | 0.0087639 | 0.34776 | 0.24801 | 40.12 | 40.12 | 40.12 | 40.12 | 40.12 |
| EBIT | -6.6 | -41.4 | -22.3 | -176.9 | -241.6 | -2.1 | -2.1 | -2.2 | -2.3 | -2.3 |
| EBIT, % | 100 | 100 | -21.76 | -1255.57 | -530.25 | -4.35 | -4.35 | -4.35 | -4.35 | -4.35 |
| Total Cash | 1.4 | 60.4 | 467.7 | 340.5 | 834.2 | 47.1 | 48.7 | 50.4 | 52.1 | 53.9 |
| Total Cash, percent | .0 | .0 | .0 | .0 | .0 | .0 | .0 | .0 | .0 | .0 |
| Account Receivables | .0 | .0 | .0 | 1.9 | 21.3 | 24.5 | 25.4 | 26.2 | 27.1 | 28.1 |
| Account Receivables, % | 100 | 100 | 0 | 13.35 | 46.76 | 52.02 | 52.02 | 52.02 | 52.02 | 52.02 |
| Inventories | .0 | .0 | .0 | .0 | .0 | 18.9 | 19.5 | 20.2 | 20.9 | 21.6 |
| Inventories, % | 100 | 100 | 0 | 0 | 0 | 40 | 40 | 40 | 40 | 40 |
| Accounts Payable | .2 | 7.1 | 11.9 | 16.9 | 4.7 | 30.3 | 31.4 | 32.5 | 33.6 | 34.7 |
| Accounts Payable, % | 100 | 100 | 11.54 | 120.11 | 10.41 | 64.39 | 64.39 | 64.39 | 64.39 | 64.39 |
| Capital Expenditure | .0 | .0 | .0 | .0 | -.7 | -.2 | -.2 | -.2 | -.2 | -.2 |
| Capital Expenditure, % | 100 | 100 | -0.01265897 | -0.17033 | -1.47 | -0.33157 | -0.33157 | -0.33157 | -0.33157 | -0.33157 |
| Tax Rate, % | 0.000413908998 | 0.000413908998 | 0.000413908998 | 0.000413908998 | 0.000413908998 | 0.000413908998 | 0.000413908998 | 0.000413908998 | 0.000413908998 | 0.000413908998 |
| EBITAT | -6.6 | -41.4 | -22.3 | -176.9 | -241.6 | -2.1 | -2.1 | -2.2 | -2.3 | -2.3 |
| Depreciation | ||||||||||
| Changes in Account Receivables | ||||||||||
| Changes in Inventories | ||||||||||
| Changes in Accounts Payable | ||||||||||
| Capital Expenditure | ||||||||||
| UFCF | -6.5 | -34.5 | -17.6 | -173.7 | -273.8 | 20.2 | 16.8 | 17.4 | 18.0 | 18.6 |
| WACC, % | 4.68 | 4.68 | 4.68 | 4.68 | 4.68 | 4.68 | 4.68 | 4.68 | 4.68 | 4.68 |
| PV UFCF | ||||||||||
| SUM PV UFCF | 79.7 | |||||||||
| Long Term Growth Rate, % | 2.00 | |||||||||
| Free cash flow (T + 1) | 19 | |||||||||
| Terminal Value | 708 | |||||||||
| Present Terminal Value | 563 | |||||||||
| Enterprise Value | 642 | |||||||||
| Net Debt | -771 | |||||||||
| Equity Value | 1,414 | |||||||||
| Diluted Shares Outstanding, MM | 94 | |||||||||
| Equity Value Per Share | 14.98 |
What You Will Receive
- Authentic NewAmsterdam Data: Preloaded financials – covering everything from revenue to EBIT – based on both actual and projected figures.
- Complete Customization: Modify all essential parameters (yellow cells) such as WACC, growth %, and tax rates.
- Immediate Valuation Adjustments: Automatic recalculations to assess the effects of changes on NewAmsterdam Pharma's fair value.
- Flexible Excel Template: Designed for easy modifications, scenario analysis, and comprehensive projections.
- Efficient and Precise: Eliminate the need to create models from the ground up while ensuring accuracy and adaptability.
Key Features
- Customizable Forecast Inputs: Adjust essential metrics such as revenue growth, EBITDA %, and capital investments to fit your analysis.
- Instant DCF Valuation: Quickly computes intrinsic value, NPV, and other financial metrics with ease.
- High-Precision Accuracy: Leverages NewAmsterdam Pharma's real-life financial data for dependable valuation results.
- Streamlined Scenario Analysis: Effortlessly explore various assumptions and evaluate their impacts.
- Efficiency Booster: Avoid the hassle of constructing intricate valuation models from the ground up.
How It Works
- 1. Access the Template: Download and open the Excel file featuring NewAmsterdam Pharma Company N.V.'s preloaded data.
- 2. Adjust Key Inputs: Modify essential parameters such as growth projections, WACC, and capital expenditures.
- 3. Get Instant Results: The DCF model automatically computes the intrinsic value and NPV in real-time.
- 4. Explore Various Scenarios: Analyze different forecasts to evaluate various valuation possibilities.
- 5. Present with Assurance: Share professional valuation findings to bolster your decision-making process.
Why Opt for This Calculator?
- Reliable Data: Utilize authentic NewAmsterdam Pharma Company (NAMSW) financials for dependable valuation outcomes.
- Tailor-Made: Modify essential factors such as growth rates, WACC, and tax rates to align with your forecasts.
- Efficiency Boost: Ready-to-use calculations save you the trouble of building from the ground up.
- Professional-Quality Tool: Crafted specifically for investors, analysts, and consultants.
- Accessible Design: Intuitive structure and clear instructions ensure ease of use for everyone.
Who Should Use This Product?
- Investors: Assess the valuation of NewAmsterdam Pharma Company N.V. (NAMSW) before making trading decisions.
- CFOs and Financial Analysts: Optimize valuation methodologies and validate financial forecasts.
- Startup Founders: Understand the valuation strategies employed by established companies like NewAmsterdam Pharma.
- Consultants: Create detailed valuation reports for your clients with a focus on NewAmsterdam Pharma Company N.V. (NAMSW).
- Students and Educators: Apply real-world examples to learn and teach effective valuation methods.
What the Template Contains
- Historical Data: Comprehensive insights into NewAmsterdam Pharma Company N.V.'s (NAMSW) previous financial performance and foundational forecasts.
- DCF and Levered DCF Models: In-depth templates for assessing the intrinsic value of NewAmsterdam Pharma Company N.V. (NAMSW).
- WACC Sheet: Pre-configured calculations for the Weighted Average Cost of Capital.
- Editable Inputs: Adjust essential drivers such as growth rates, EBITDA %, and CAPEX assumptions.
- Quarterly and Annual Statements: A thorough analysis of NewAmsterdam Pharma Company N.V.'s (NAMSW) financial statements.
- Interactive Dashboard: Dynamically visualize valuation outcomes and forecast scenarios.
Disclaimer
All information, articles, and product details provided on this website are for general informational and educational purposes only. We do not claim any ownership over, nor do we intend to infringe upon, any trademarks, copyrights, logos, brand names, or other intellectual property mentioned or depicted on this site. Such intellectual property remains the property of its respective owners, and any references here are made solely for identification or informational purposes, without implying any affiliation, endorsement, or partnership.
We make no representations or warranties, express or implied, regarding the accuracy, completeness, or suitability of any content or products presented. Nothing on this website should be construed as legal, tax, investment, financial, medical, or other professional advice. In addition, no part of this site—including articles or product references—constitutes a solicitation, recommendation, endorsement, advertisement, or offer to buy or sell any securities, franchises, or other financial instruments, particularly in jurisdictions where such activity would be unlawful.
All content is of a general nature and may not address the specific circumstances of any individual or entity. It is not a substitute for professional advice or services. Any actions you take based on the information provided here are strictly at your own risk. You accept full responsibility for any decisions or outcomes arising from your use of this website and agree to release us from any liability in connection with your use of, or reliance upon, the content or products found herein.