
|
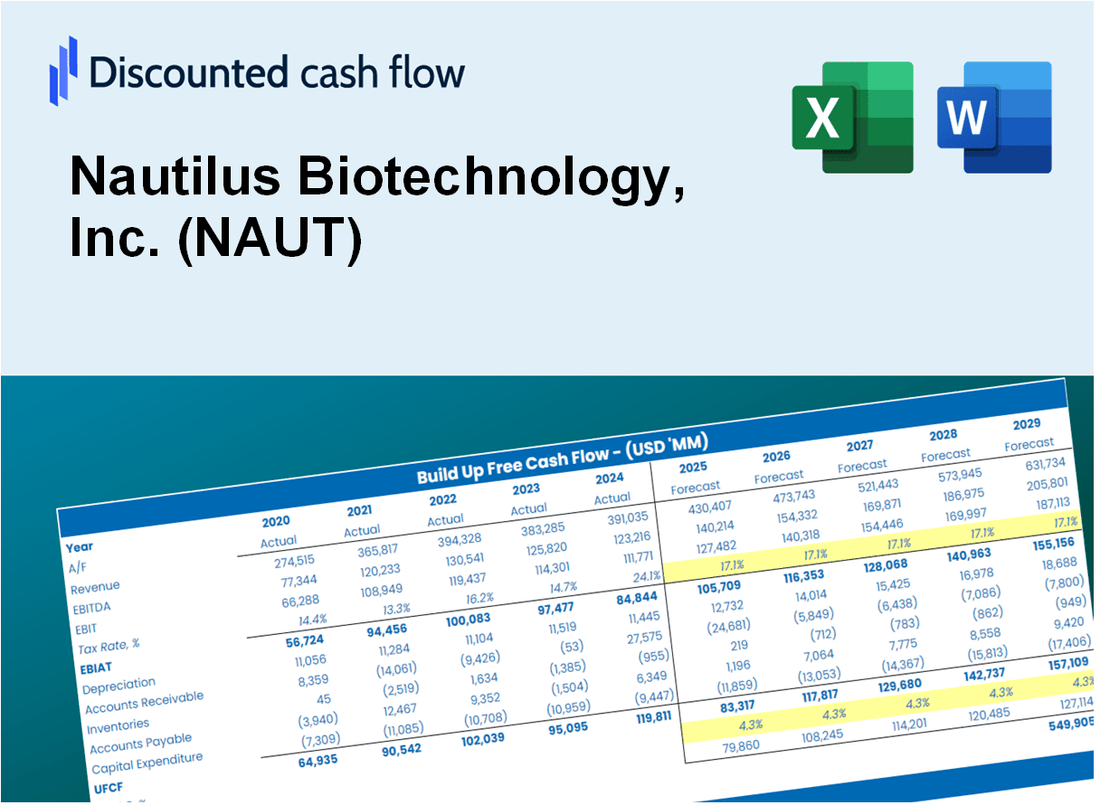
Nautilus Biotechnology, Inc. (Naut) DCF -Bewertung |
Fully Editable: Tailor To Your Needs In Excel Or Sheets
Professional Design: Trusted, Industry-Standard Templates
Investor-Approved Valuation Models
MAC/PC Compatible, Fully Unlocked
No Expertise Is Needed; Easy To Follow
Nautilus Biotechnology, Inc. (NAUT) Bundle
Explore Nautilus Biotechnology, Inc. (Naut) Finanzielle Zukunft mit unserem benutzerfreundlichen DCF-Taschenrechner! Geben Sie Ihre Annahmen für Wachstum, Margen und Kosten für die Berechnung von Nautilus Biotechnology, Inc. (Naut) ein und formen Sie Ihre Anlagestrategie.
What You Will Get
- Real NAUT Financial Data: Pre-filled with Nautilus Biotechnology’s historical and projected data for precise analysis.
- Fully Editable Template: Modify key inputs like revenue growth, WACC, and EBITDA % with ease.
- Automatic Calculations: See Nautilus Biotechnology’s intrinsic value update instantly based on your changes.
- Professional Valuation Tool: Designed for investors, analysts, and consultants seeking accurate DCF results.
- User-Friendly Design: Simple structure and clear instructions for all experience levels.
Key Features
- Pre-Loaded Data: Nautilus Biotechnology’s historical financial statements and pre-filled forecasts.
- Fully Adjustable Inputs: Modify WACC, tax rates, revenue growth, and EBITDA margins.
- Instant Results: View Nautilus Biotechnology’s intrinsic value recalculating in real time.
- Clear Visual Outputs: Dashboard charts showcase valuation results and key metrics.
- Built for Accuracy: A professional tool designed for analysts, investors, and finance experts.
How It Works
- Step 1: Download the Excel file.
- Step 2: Review Nautilus Biotechnology, Inc.'s pre-filled financial data and forecasts.
- Step 3: Modify key inputs such as revenue growth, WACC, and tax rates (highlighted cells).
- Step 4: Observe the DCF model update in real-time as you adjust assumptions.
- Step 5: Evaluate the outputs and leverage the results for investment decisions.
Why Choose This Calculator for Nautilus Biotechnology, Inc. (NAUT)?
- All-in-One Solution: Combines DCF, WACC, and financial ratio analyses tailored for Nautilus Biotechnology.
- Flexible Inputs: Modify yellow-highlighted fields to explore different financial scenarios.
- In-Depth Analysis: Automatically computes Nautilus Biotechnology’s intrinsic value and Net Present Value.
- Preloaded Information: Historical and projected data provide reliable starting points for analysis.
- High-Quality Standards: Perfect for financial analysts, investors, and business consultants focused on biotechnology.
Who Should Use This Product?
- Investors: Evaluate Nautilus Biotechnology’s valuation before making investment decisions.
- CFOs and Financial Analysts: Optimize valuation methodologies and assess financial forecasts.
- Startup Founders: Gain insights into how biotechnology companies like Nautilus are valued.
- Consultants: Provide comprehensive valuation analyses for clients in the biotech sector.
- Students and Educators: Utilize current data to learn and teach valuation strategies in biotechnology.
What the Nautilus Biotechnology Template Contains
- Comprehensive DCF Model: Editable template featuring detailed valuation calculations tailored for Nautilus Biotechnology.
- Real-World Data: Nautilus Biotechnology's historical and projected financials preloaded for thorough analysis.
- Customizable Parameters: Modify WACC, growth rates, and tax assumptions to explore various scenarios.
- Financial Statements: Complete annual and quarterly breakdowns for enhanced insights into performance.
- Key Ratios: Integrated analysis for profitability, efficiency, and financial leverage.
- Dashboard with Visual Outputs: Visualizations including charts and tables for clear, actionable insights.
Disclaimer
All information, articles, and product details provided on this website are for general informational and educational purposes only. We do not claim any ownership over, nor do we intend to infringe upon, any trademarks, copyrights, logos, brand names, or other intellectual property mentioned or depicted on this site. Such intellectual property remains the property of its respective owners, and any references here are made solely for identification or informational purposes, without implying any affiliation, endorsement, or partnership.
We make no representations or warranties, express or implied, regarding the accuracy, completeness, or suitability of any content or products presented. Nothing on this website should be construed as legal, tax, investment, financial, medical, or other professional advice. In addition, no part of this site—including articles or product references—constitutes a solicitation, recommendation, endorsement, advertisement, or offer to buy or sell any securities, franchises, or other financial instruments, particularly in jurisdictions where such activity would be unlawful.
All content is of a general nature and may not address the specific circumstances of any individual or entity. It is not a substitute for professional advice or services. Any actions you take based on the information provided here are strictly at your own risk. You accept full responsibility for any decisions or outcomes arising from your use of this website and agree to release us from any liability in connection with your use of, or reliance upon, the content or products found herein.