
|
Navient Corporation (NAVI) DCF -Bewertung |
Fully Editable: Tailor To Your Needs In Excel Or Sheets
Professional Design: Trusted, Industry-Standard Templates
Investor-Approved Valuation Models
MAC/PC Compatible, Fully Unlocked
No Expertise Is Needed; Easy To Follow
Navient Corporation (NAVI) Bundle
Erwerben Sie die Bewertungsanalyse für Ihre Navient Corporation (NAVI) mit unserem ausgefeilten DCF -Taschenrechner! Diese Excel -Vorlage wird mit tatsächlichen NAVI -Daten vorgeladen, sodass Sie Prognosen und Annahmen anpassen können, um den inneren Wert der Navient Corporation genau zu bestimmen.
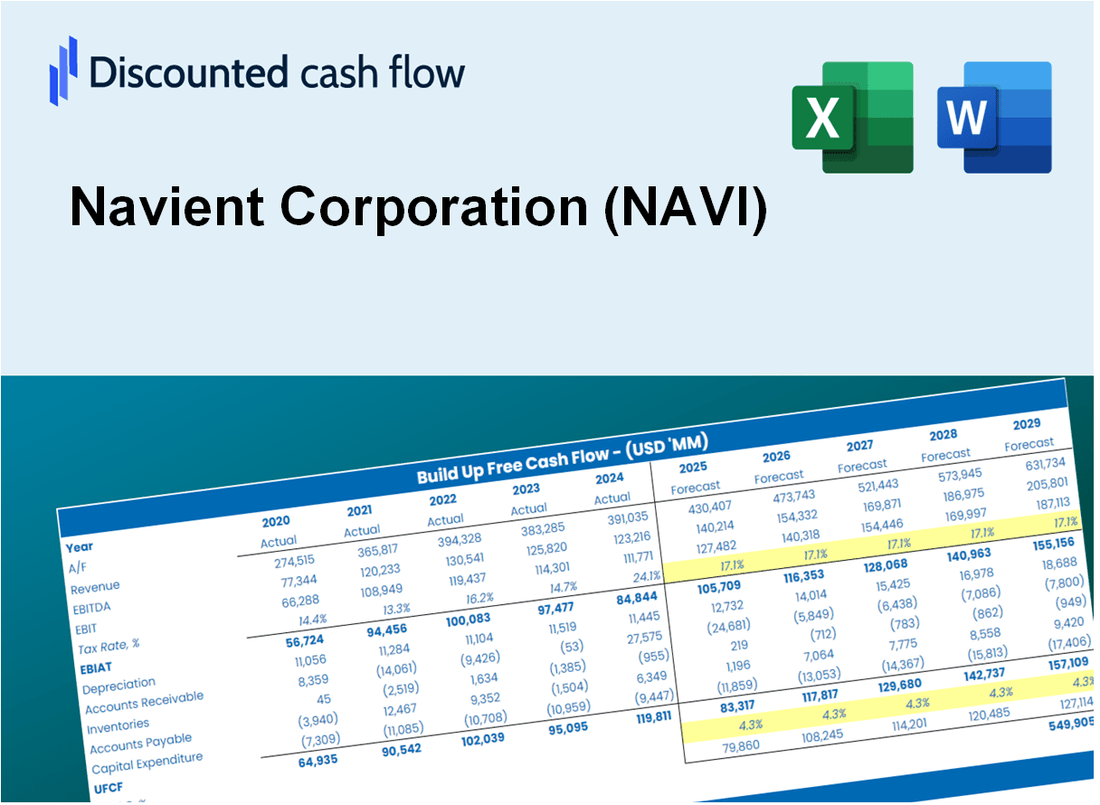
Discounted Cash Flow (DCF) - (USD MM)
| Year | AY1 2020 |
AY2 2021 |
AY3 2022 |
AY4 2023 |
AY5 2024 |
FY1 2025 |
FY2 2026 |
FY3 2027 |
FY4 2028 |
FY5 2029 |
|---|---|---|---|---|---|---|---|---|---|---|
| Revenue | 3,694.0 | 3,527.0 | 3,839.0 | 4,920.0 | 4,234.0 | 4,430.3 | 4,635.6 | 4,850.5 | 5,075.3 | 5,310.5 |
| Revenue Growth, % | 0 | -4.52 | 8.85 | 28.16 | -13.94 | 4.64 | 4.64 | 4.64 | 4.64 | 4.64 |
| EBITDA | 2,829.0 | 2,656.0 | 3,041.0 | 3,951.0 | 3,467.0 | 3,484.8 | 3,646.3 | 3,815.3 | 3,992.1 | 4,177.2 |
| EBITDA, % | 76.58 | 75.3 | 79.21 | 80.3 | 81.88 | 78.66 | 78.66 | 78.66 | 78.66 | 78.66 |
| Depreciation | 22.0 | 30.0 | 19.0 | 10.0 | 146.0 | 49.6 | 51.9 | 54.3 | 56.8 | 59.4 |
| Depreciation, % | 0.59556 | 0.85058 | 0.49492 | 0.20325 | 3.45 | 1.12 | 1.12 | 1.12 | 1.12 | 1.12 |
| EBIT | 2,807.0 | 2,626.0 | 3,022.0 | 3,941.0 | 3,321.0 | 3,435.2 | 3,594.4 | 3,761.0 | 3,935.4 | 4,117.8 |
| EBIT, % | 75.99 | 74.45 | 78.72 | 80.1 | 78.44 | 77.54 | 77.54 | 77.54 | 77.54 | 77.54 |
| Total Cash | 1,183.0 | 905.0 | 1,535.0 | 839.0 | 722.0 | 1,167.6 | 1,221.7 | 1,278.3 | 1,337.6 | 1,399.6 |
| Total Cash, percent | .0 | .0 | .0 | .0 | .0 | .0 | .0 | .0 | .0 | .0 |
| Account Receivables | 2,051.0 | 2,409.0 | 2,246.0 | 2,182.0 | 1,902.0 | 2,406.5 | 2,518.1 | 2,634.8 | 2,756.9 | 2,884.7 |
| Account Receivables, % | 55.52 | 68.3 | 58.5 | 44.35 | 44.92 | 54.32 | 54.32 | 54.32 | 54.32 | 54.32 |
| Inventories | .0 | 5,618.0 | 6,921.0 | 489.0 | .0 | 1,860.2 | 1,946.4 | 2,036.6 | 2,131.0 | 2,229.8 |
| Inventories, % | 0 | 159.29 | 180.28 | 9.94 | 0 | 41.99 | 41.99 | 41.99 | 41.99 | 41.99 |
| Accounts Payable | .0 | .0 | .0 | .0 | .0 | .0 | .0 | .0 | .0 | .0 |
| Accounts Payable, % | 0 | 0 | 0 | 0 | 0 | 0 | 0 | 0 | 0 | 0 |
| Capital Expenditure | .0 | .0 | .0 | .0 | .0 | .0 | .0 | .0 | .0 | .0 |
| Capital Expenditure, % | 0 | 0 | 0 | 0 | 0 | 0 | 0 | 0 | 0 | 0 |
| Tax Rate, % | 24.71 | 24.71 | 24.71 | 24.71 | 24.71 | 24.71 | 24.71 | 24.71 | 24.71 | 24.71 |
| EBITAT | 2,173.8 | 2,011.6 | 2,356.9 | 2,870.8 | 2,500.3 | 2,611.9 | 2,733.0 | 2,859.7 | 2,992.2 | 3,130.9 |
| Depreciation | ||||||||||
| Changes in Account Receivables | ||||||||||
| Changes in Inventories | ||||||||||
| Changes in Accounts Payable | ||||||||||
| Capital Expenditure | ||||||||||
| UFCF | 144.8 | -3,934.4 | 1,235.9 | 9,376.8 | 3,415.3 | 296.8 | 2,587.1 | 2,707.0 | 2,832.5 | 2,963.7 |
| WACC, % | 5.37 | 5.32 | 5.41 | 5.07 | 5.23 | 5.28 | 5.28 | 5.28 | 5.28 | 5.28 |
| PV UFCF | ||||||||||
| SUM PV UFCF | 9,533.1 | |||||||||
| Long Term Growth Rate, % | 2.00 | |||||||||
| Free cash flow (T + 1) | 3,023 | |||||||||
| Terminal Value | 92,195 | |||||||||
| Present Terminal Value | 71,285 | |||||||||
| Enterprise Value | 80,818 | |||||||||
| Net Debt | 42,462 | |||||||||
| Equity Value | 38,356 | |||||||||
| Diluted Shares Outstanding, MM | 111 | |||||||||
| Equity Value Per Share | 345.55 |
What You Will Get
- Real NAVI Financial Data: Pre-filled with Navient Corporation’s historical and projected data for precise analysis.
- Fully Editable Template: Modify key inputs like revenue growth, WACC, and EBITDA % with ease.
- Automatic Calculations: See NAVI’s intrinsic value update instantly based on your changes.
- Professional Valuation Tool: Designed for investors, analysts, and consultants seeking accurate DCF results.
- User-Friendly Design: Simple structure and clear instructions for all experience levels.
Key Features
- Comprehensive Loan Management Tools: Tailored solutions for managing student and education loans efficiently.
- Customizable Payment Plans: Flexible options for borrowers to adjust repayment schedules and amounts.
- Robust Data Analytics: Insights into loan performance and borrower behavior for informed decision-making.
- Integrated Customer Support: Access to resources and assistance for borrowers navigating their loan options.
- User-Friendly Dashboard: Intuitive interface for tracking loan status and managing accounts seamlessly.
How It Works
- 1. Access the Template: Download and open the Excel file containing Navient Corporation's (NAVI) financial data.
- 2. Modify Assumptions: Adjust key parameters such as growth projections, WACC, and capital expenditures.
- 3. Instant Results: The DCF model automatically computes intrinsic value and NPV based on your inputs.
- 4. Evaluate Scenarios: Analyze various forecasts to understand different valuation possibilities.
- 5. Present with Assurance: Deliver expert valuation insights to back your financial decisions.
Why Choose This Calculator for Navient Corporation (NAVI)?
- User-Friendly Interface: Tailored for both novice users and seasoned professionals.
- Customizable Inputs: Adjust parameters easily to suit your financial analysis.
- Real-Time Valuation: Observe immediate updates to Navient’s valuation as you make changes.
- Preloaded Data: Comes with Navient’s actual financial metrics for swift evaluations.
- Relied Upon by Experts: Favored by investors and analysts for making well-informed choices.
Who Should Use This Product?
- Individual Investors: Make informed decisions about buying or selling Navient Corporation (NAVI) stock.
- Financial Analysts: Streamline valuation processes with ready-to-use financial models for Navient Corporation (NAVI).
- Consultants: Deliver professional valuation insights on Navient Corporation (NAVI) to clients quickly and accurately.
- Business Owners: Understand how companies like Navient Corporation (NAVI) are valued to guide your own strategy.
- Finance Students: Learn valuation techniques using real-world data and scenarios related to Navient Corporation (NAVI).
What the Template Contains
- Historical Data: Includes Navient Corporation’s (NAVI) past financials and baseline forecasts.
- DCF and Levered DCF Models: Detailed templates to calculate Navient Corporation’s (NAVI) intrinsic value.
- WACC Sheet: Pre-built calculations for Weighted Average Cost of Capital specific to Navient Corporation (NAVI).
- Editable Inputs: Modify key drivers like growth rates, EBITDA %, and CAPEX assumptions for Navient Corporation (NAVI).
- Quarterly and Annual Statements: A complete breakdown of Navient Corporation’s (NAVI) financials.
- Interactive Dashboard: Visualize valuation results and projections for Navient Corporation (NAVI) dynamically.
Disclaimer
All information, articles, and product details provided on this website are for general informational and educational purposes only. We do not claim any ownership over, nor do we intend to infringe upon, any trademarks, copyrights, logos, brand names, or other intellectual property mentioned or depicted on this site. Such intellectual property remains the property of its respective owners, and any references here are made solely for identification or informational purposes, without implying any affiliation, endorsement, or partnership.
We make no representations or warranties, express or implied, regarding the accuracy, completeness, or suitability of any content or products presented. Nothing on this website should be construed as legal, tax, investment, financial, medical, or other professional advice. In addition, no part of this site—including articles or product references—constitutes a solicitation, recommendation, endorsement, advertisement, or offer to buy or sell any securities, franchises, or other financial instruments, particularly in jurisdictions where such activity would be unlawful.
All content is of a general nature and may not address the specific circumstances of any individual or entity. It is not a substitute for professional advice or services. Any actions you take based on the information provided here are strictly at your own risk. You accept full responsibility for any decisions or outcomes arising from your use of this website and agree to release us from any liability in connection with your use of, or reliance upon, the content or products found herein.