
|
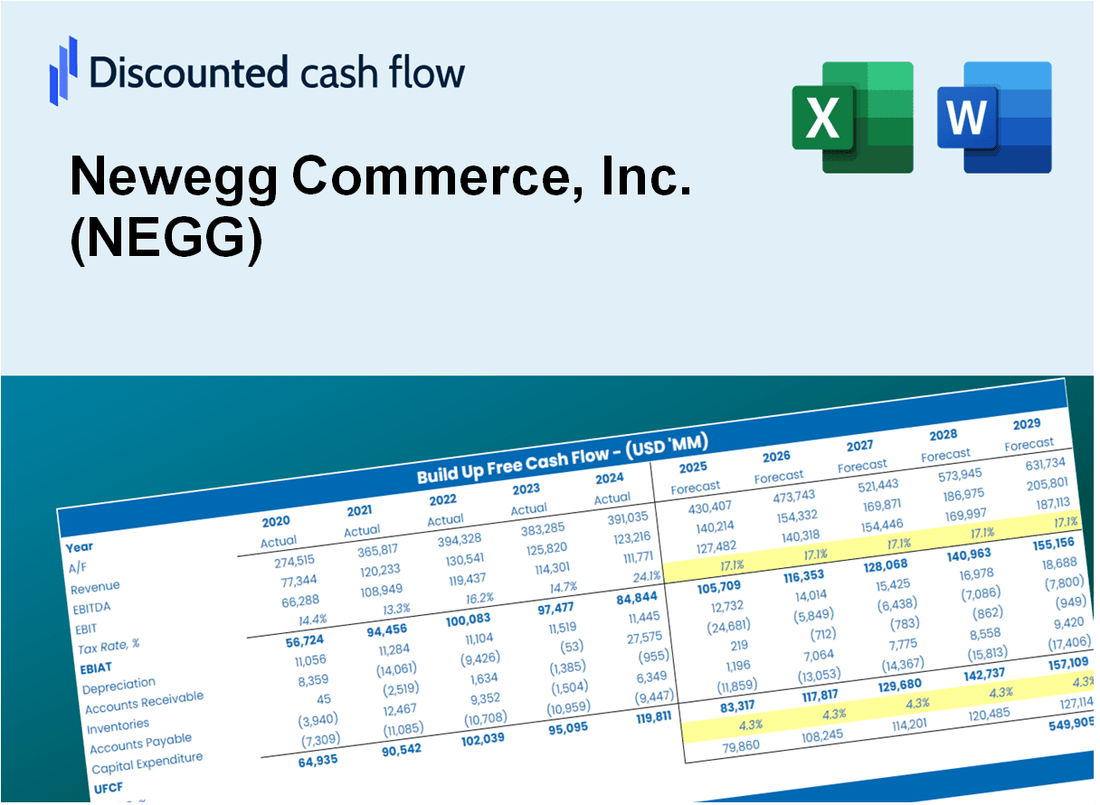
NewEgg Commerce, Inc. (Negg) DCF -Bewertung |
Fully Editable: Tailor To Your Needs In Excel Or Sheets
Professional Design: Trusted, Industry-Standard Templates
Investor-Approved Valuation Models
MAC/PC Compatible, Fully Unlocked
No Expertise Is Needed; Easy To Follow
Newegg Commerce, Inc. (NEGG) Bundle
Gewinnen Sie einen Einblick in Ihre Bewertungsanalyse für NewEgg Commerce, Inc. (NEGG) mit unserem leistungsstarken DCF -Taschenrechner! Diese Excel -Vorlage wird mit realen Negg -Daten vorgeladen, sodass Sie Prognosen und Annahmen anpassen können, um den inneren Wert von NewEgg Commerce, Inc. (Negg) genau zu berechnen.
What You Will Get
- Real Newegg Data: Preloaded financials – from revenue to EBIT – based on actual and projected figures.
- Full Customization: Adjust all critical parameters (yellow cells) like WACC, growth %, and tax rates.
- Instant Valuation Updates: Automatic recalculations to analyze the impact of changes on Newegg’s fair value.
- Versatile Excel Template: Tailored for quick edits, scenario testing, and detailed projections.
- Time-Saving and Accurate: Skip building models from scratch while maintaining precision and flexibility.
Key Features
- Customizable Sales Projections: Adjust key metrics such as sales growth, gross margin %, and operating expenses.
- Instant Valuation Calculations: Provides immediate insights into intrinsic value, NPV, and other financial metrics.
- High-Precision Estimates: Leverages Newegg's actual financial data for accurate valuation results.
- Effortless Scenario Testing: Easily evaluate various assumptions and analyze different outcomes.
- Efficiency Booster: Avoid the hassle of constructing intricate valuation models from the ground up.
How It Works
- Step 1: Download the prebuilt Excel template featuring Newegg Commerce, Inc. (NEGG) data.
- Step 2: Review the pre-filled sheets to familiarize yourself with the essential metrics.
- Step 3: Adjust forecasts and assumptions in the editable yellow cells (WACC, growth, margins).
- Step 4: Instantly see recalculated results, including Newegg’s intrinsic value.
- Step 5: Make informed investment decisions or create reports based on the outputs.
Why Choose Newegg Commerce, Inc. (NEGG)?
- Save Time: Quickly access a wide range of electronics without the hassle of extensive research.
- Enhance Shopping Experience: User-friendly interface and detailed product descriptions minimize confusion.
- Wide Selection: Extensive inventory ensures you find exactly what you need.
- Competitive Pricing: Attractive deals and discounts help you save money on your purchases.
- Trusted by Customers: A reputation for quality service and reliable products makes us a preferred choice.
Who Should Use This Product?
- Tech Enthusiasts: Explore the latest hardware and software trends through real-time data analysis.
- Academics: Integrate cutting-edge e-commerce strategies into your research or teaching materials.
- Investors: Evaluate your investment strategies and assess the performance metrics for Newegg Commerce, Inc. (NEGG).
- Market Analysts: Enhance your analytical capabilities with a comprehensive e-commerce performance model.
- Entrepreneurs: Discover how major online retailers like Newegg are structured and evaluated in the marketplace.
What the Template Contains
- Comprehensive DCF Model: Editable template with detailed valuation calculations tailored for Newegg Commerce, Inc. (NEGG).
- Real-World Data: Newegg’s historical and projected financials preloaded for thorough analysis.
- Customizable Parameters: Adjust WACC, growth rates, and tax assumptions to explore various scenarios.
- Financial Statements: Complete annual and quarterly breakdowns for enhanced insights into performance.
- Key Ratios: Integrated analysis for profitability, efficiency, and leverage specific to Newegg Commerce, Inc. (NEGG).
- Dashboard with Visual Outputs: Charts and tables for clear, actionable results regarding Newegg’s financial health.
Disclaimer
All information, articles, and product details provided on this website are for general informational and educational purposes only. We do not claim any ownership over, nor do we intend to infringe upon, any trademarks, copyrights, logos, brand names, or other intellectual property mentioned or depicted on this site. Such intellectual property remains the property of its respective owners, and any references here are made solely for identification or informational purposes, without implying any affiliation, endorsement, or partnership.
We make no representations or warranties, express or implied, regarding the accuracy, completeness, or suitability of any content or products presented. Nothing on this website should be construed as legal, tax, investment, financial, medical, or other professional advice. In addition, no part of this site—including articles or product references—constitutes a solicitation, recommendation, endorsement, advertisement, or offer to buy or sell any securities, franchises, or other financial instruments, particularly in jurisdictions where such activity would be unlawful.
All content is of a general nature and may not address the specific circumstances of any individual or entity. It is not a substitute for professional advice or services. Any actions you take based on the information provided here are strictly at your own risk. You accept full responsibility for any decisions or outcomes arising from your use of this website and agree to release us from any liability in connection with your use of, or reliance upon, the content or products found herein.