
|
Netflix, Inc. (NFLX) DCF -Bewertung |
Fully Editable: Tailor To Your Needs In Excel Or Sheets
Professional Design: Trusted, Industry-Standard Templates
Investor-Approved Valuation Models
MAC/PC Compatible, Fully Unlocked
No Expertise Is Needed; Easy To Follow
Netflix, Inc. (NFLX) Bundle
Bewerten Sie die finanziellen Aussichten von Netflix, Inc. (NFLX) wie ein Experte! Dieser [Symbol] DCF-Taschenrechner bietet Ihnen vorgefüllte Finanzdaten und die Flexibilität, das Umsatzwachstum, WACC, Margen und andere wesentliche Annahmen zu ändern, um sich an Ihren Vorhersagen auszurichten.
What You Will Get
- Editable Excel Template: A fully customizable Excel-based DCF Calculator featuring pre-filled real NFLX financials.
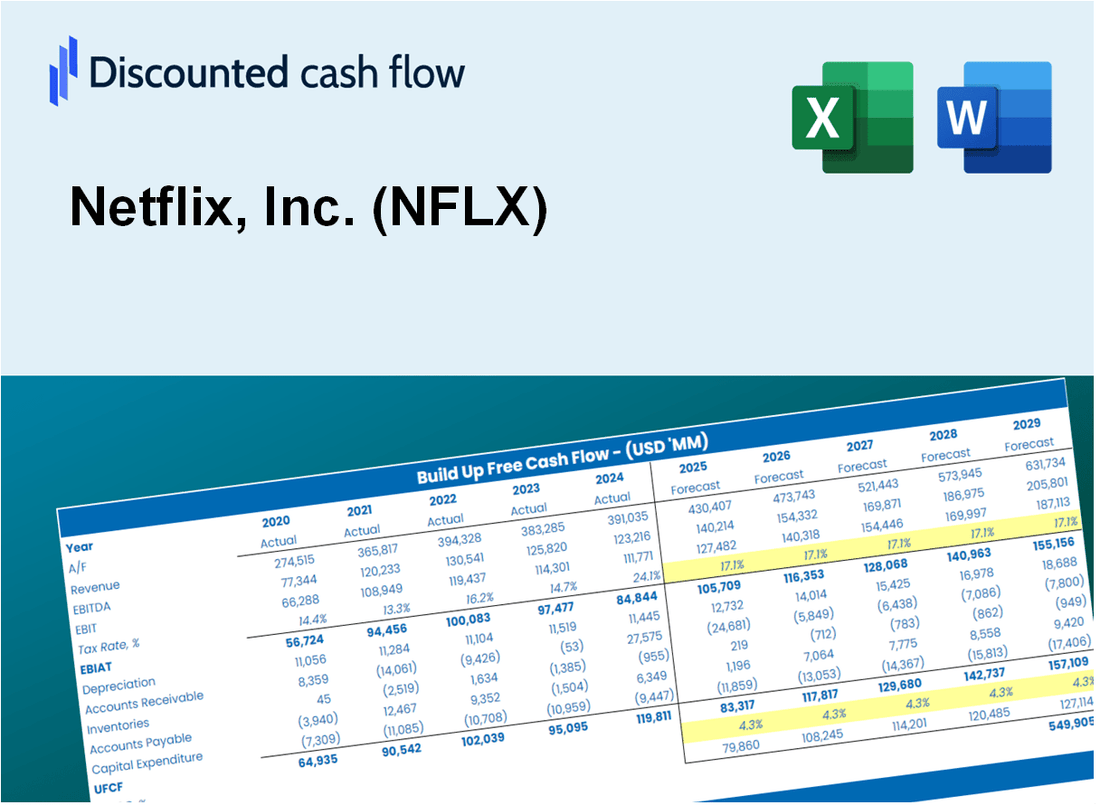
- Real-World Data: Historical data and forward-looking estimates (as highlighted in the yellow cells).
- Forecast Flexibility: Adjust forecast assumptions such as revenue growth, EBITDA %, and WACC.
- Automatic Calculations: Instantly observe the effects of your inputs on Netflix’s valuation.
- Professional Tool: Designed for investors, CFOs, consultants, and financial analysts.
- User-Friendly Design: Organized for clarity and ease of use, complete with step-by-step instructions.
Key Features
- Comprehensive Netflix Financials: Access reliable pre-loaded historical data and future forecasts.
- Adjustable Forecast Parameters: Modify yellow-highlighted cells such as WACC, growth rates, and profit margins.
- Real-Time Calculations: Automatic updates for DCF, Net Present Value (NPV), and cash flow assessments.
- Interactive Dashboard: User-friendly charts and summaries for clear visualization of your valuation outcomes.
- Suitable for All Levels: An intuitive and straightforward design tailored for investors, CFOs, and consultants.
How It Works
- 1. Access the Template: Download and open the Excel file containing Netflix, Inc.'s (NFLX) preloaded data.
- 2. Adjust Assumptions: Modify key parameters such as subscriber growth rates, WACC, and capital expenditures.
- 3. View Results Instantly: The DCF model automatically calculates intrinsic value and NPV based on your inputs.
- 4. Explore Scenarios: Analyze various forecasts to evaluate different valuation possibilities.
- 5. Utilize with Assurance: Present professional valuation insights to bolster your decision-making process.
Why Choose This Calculator?
- Accurate Data: Real Netflix financials ensure reliable valuation results.
- Customizable: Adjust key parameters like growth rates, WACC, and tax rates to match your projections.
- Time-Saving: Pre-built calculations eliminate the need to start from scratch.
- Professional-Grade Tool: Designed for investors, analysts, and consultants.
- User-Friendly: Intuitive layout and step-by-step instructions make it easy for all users.
Who Should Use Netflix, Inc. (NFLX)?
- Streamers: Enjoy a diverse library of movies and shows tailored to your preferences.
- Families: Access family-friendly content and parental controls for safe viewing.
- Content Creators: Explore opportunities for collaboration and distribution on a global platform.
- Film Buffs: Discover classic films and critically acclaimed original series.
- Students and Educators: Utilize documentaries and educational series for learning and research purposes.
What the Template Contains
- Pre-Filled DCF Model: Netflix’s financial data preloaded for immediate use.
- WACC Calculator: Detailed calculations for Weighted Average Cost of Capital.
- Financial Ratios: Evaluate Netflix’s profitability, leverage, and efficiency.
- Editable Inputs: Change assumptions such as growth, margins, and CAPEX to fit your scenarios.
- Financial Statements: Annual and quarterly reports to support detailed analysis.
- Interactive Dashboard: Easily visualize key valuation metrics and results.
Disclaimer
All information, articles, and product details provided on this website are for general informational and educational purposes only. We do not claim any ownership over, nor do we intend to infringe upon, any trademarks, copyrights, logos, brand names, or other intellectual property mentioned or depicted on this site. Such intellectual property remains the property of its respective owners, and any references here are made solely for identification or informational purposes, without implying any affiliation, endorsement, or partnership.
We make no representations or warranties, express or implied, regarding the accuracy, completeness, or suitability of any content or products presented. Nothing on this website should be construed as legal, tax, investment, financial, medical, or other professional advice. In addition, no part of this site—including articles or product references—constitutes a solicitation, recommendation, endorsement, advertisement, or offer to buy or sell any securities, franchises, or other financial instruments, particularly in jurisdictions where such activity would be unlawful.
All content is of a general nature and may not address the specific circumstances of any individual or entity. It is not a substitute for professional advice or services. Any actions you take based on the information provided here are strictly at your own risk. You accept full responsibility for any decisions or outcomes arising from your use of this website and agree to release us from any liability in connection with your use of, or reliance upon, the content or products found herein.