
|
New Gold Inc. (NGD) DCF -Bewertung |
Fully Editable: Tailor To Your Needs In Excel Or Sheets
Professional Design: Trusted, Industry-Standard Templates
Investor-Approved Valuation Models
MAC/PC Compatible, Fully Unlocked
No Expertise Is Needed; Easy To Follow
New Gold Inc. (NGD) Bundle
Möchten Sie den inneren Wert von New Gold Inc. bestimmen? Unser NGD DCF-Taschenrechner integriert reale Daten mit umfangreichen Anpassungsfunktionen, sodass Sie Ihre Prognosen verfeinern und Ihre Investitionsauswahl verbessern können.
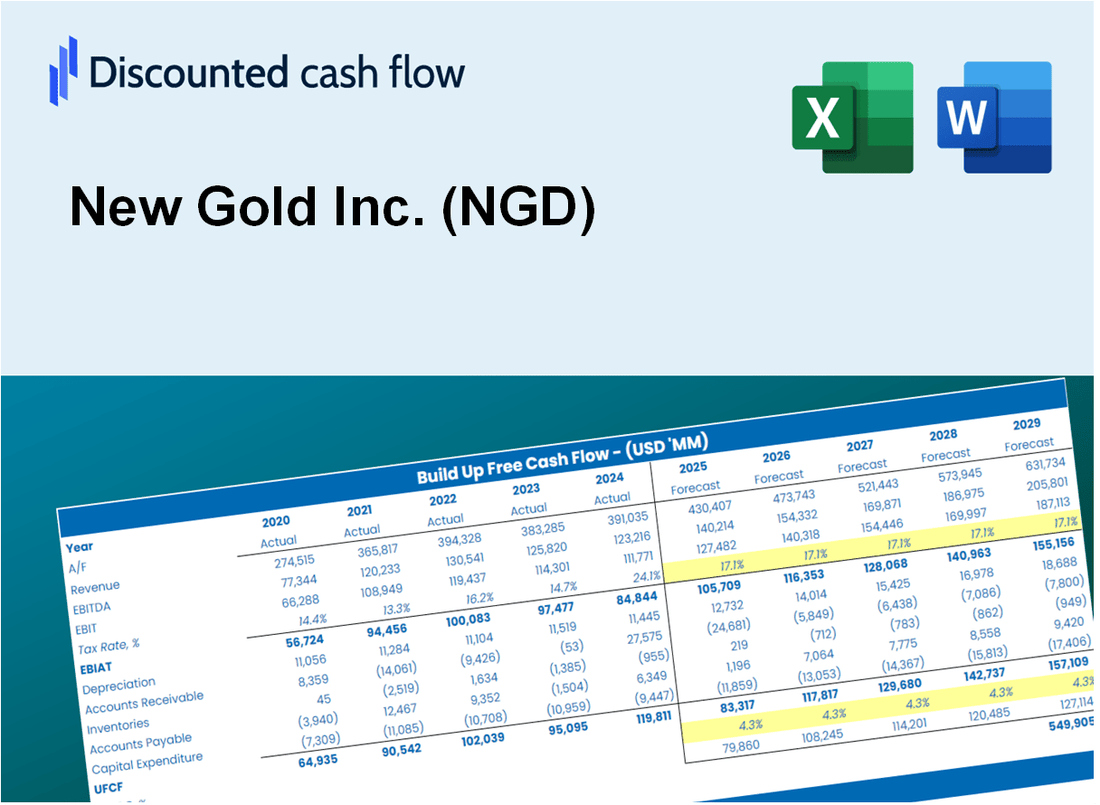
Discounted Cash Flow (DCF) - (USD MM)
| Year | AY1 2020 |
AY2 2021 |
AY3 2022 |
AY4 2023 |
AY5 2024 |
FY1 2025 |
FY2 2026 |
FY3 2027 |
FY4 2028 |
FY5 2029 |
|---|---|---|---|---|---|---|---|---|---|---|
| Revenue | 643.4 | 745.5 | 604.4 | 786.5 | 924.5 | 1,027.6 | 1,142.2 | 1,269.7 | 1,411.3 | 1,568.7 |
| Revenue Growth, % | 0 | 15.87 | -18.93 | 30.13 | 17.55 | 11.15 | 11.15 | 11.15 | 11.15 | 11.15 |
| EBITDA | 250.3 | 388.5 | 147.9 | 192.6 | 331.7 | 361.4 | 401.7 | 446.5 | 496.3 | 551.7 |
| EBITDA, % | 38.9 | 52.11 | 24.47 | 24.48 | 35.88 | 35.17 | 35.17 | 35.17 | 35.17 | 35.17 |
| Depreciation | 186.0 | 198.9 | 192.5 | 244.2 | 240.7 | 297.0 | 330.1 | 367.0 | 407.9 | 453.4 |
| Depreciation, % | 28.91 | 26.68 | 31.84 | 31.05 | 26.03 | 28.9 | 28.9 | 28.9 | 28.9 | 28.9 |
| EBIT | 64.3 | 189.5 | -44.6 | -51.6 | 91.0 | 64.4 | 71.6 | 79.5 | 88.4 | 98.3 |
| EBIT, % | 9.99 | 25.42 | -7.37 | -6.56 | 9.84 | 6.26 | 6.26 | 6.26 | 6.26 | 6.26 |
| Total Cash | 231.7 | 541.0 | 236.4 | 192.6 | 110.3 | 378.4 | 420.6 | 467.5 | 519.7 | 577.6 |
| Total Cash, percent | .0 | .0 | .0 | .0 | .0 | .0 | .0 | .0 | .0 | .0 |
| Account Receivables | 81.1 | 30.1 | 4.4 | 10.2 | 21.6 | 43.2 | 48.0 | 53.3 | 59.3 | 65.9 |
| Account Receivables, % | 12.6 | 4.04 | 0.72799 | 1.3 | 2.34 | 4.2 | 4.2 | 4.2 | 4.2 | 4.2 |
| Inventories | 93.3 | 101.0 | 115.7 | 126.7 | 118.7 | 156.5 | 173.9 | 193.3 | 214.9 | 238.9 |
| Inventories, % | 14.5 | 13.55 | 19.14 | 16.11 | 12.84 | 15.23 | 15.23 | 15.23 | 15.23 | 15.23 |
| Accounts Payable | 41.6 | 52.0 | 61.8 | 61.5 | 36.9 | 72.9 | 81.0 | 90.1 | 100.1 | 111.3 |
| Accounts Payable, % | 6.47 | 6.98 | 10.23 | 7.82 | 3.99 | 7.1 | 7.1 | 7.1 | 7.1 | 7.1 |
| Capital Expenditure | -284.2 | -247.3 | -292.9 | -265.9 | -271.1 | -388.3 | -431.6 | -479.8 | -533.3 | -592.8 |
| Capital Expenditure, % | -44.17 | -33.17 | -48.46 | -33.81 | -29.32 | -37.79 | -37.79 | -37.79 | -37.79 | -37.79 |
| Tax Rate, % | -23.32 | -23.32 | -23.32 | -23.32 | -23.32 | -23.32 | -23.32 | -23.32 | -23.32 | -23.32 |
| EBITAT | 68.0 | 166.2 | -45.5 | -56.3 | 112.2 | 62.8 | 69.8 | 77.6 | 86.2 | 95.9 |
| Depreciation | ||||||||||
| Changes in Account Receivables | ||||||||||
| Changes in Inventories | ||||||||||
| Changes in Accounts Payable | ||||||||||
| Capital Expenditure | ||||||||||
| UFCF | -163.0 | 171.6 | -125.2 | -95.1 | 53.8 | -51.8 | -45.8 | -50.9 | -56.6 | -62.9 |
| WACC, % | 10.54 | 10.51 | 10.54 | 10.54 | 10.54 | 10.53 | 10.53 | 10.53 | 10.53 | 10.53 |
| PV UFCF | ||||||||||
| SUM PV UFCF | -198.2 | |||||||||
| Long Term Growth Rate, % | 2.00 | |||||||||
| Free cash flow (T + 1) | -64 | |||||||||
| Terminal Value | -752 | |||||||||
| Present Terminal Value | -456 | |||||||||
| Enterprise Value | -654 | |||||||||
| Net Debt | 295 | |||||||||
| Equity Value | -949 | |||||||||
| Diluted Shares Outstanding, MM | 752 | |||||||||
| Equity Value Per Share | -1.26 |
What You Will Get
- Real NGD Financials: Access to historical and projected data for precise valuation.
- Customizable Inputs: Adjust WACC, tax rates, revenue growth, and capital expenditures as needed.
- Dynamic Calculations: Intrinsic value and NPV are computed automatically.
- Scenario Analysis: Evaluate various scenarios to assess New Gold Inc.'s future performance.
- User-Friendly Interface: Designed for professionals but easy for beginners to navigate.
Key Features
- Real-Life NGD Data: Pre-filled with New Gold Inc.'s historical financials and forward-looking projections.
- Fully Customizable Inputs: Adjust revenue growth, margins, WACC, tax rates, and capital expenditures.
- Dynamic Valuation Model: Automatic updates to Net Present Value (NPV) and intrinsic value based on your inputs.
- Scenario Testing: Create multiple forecast scenarios to analyze different valuation outcomes.
- User-Friendly Design: Simple, structured, and designed for professionals and beginners alike.
How It Works
- Step 1: Download the Excel file.
- Step 2: Review New Gold Inc.’s pre-filled financial data and forecasts.
- Step 3: Modify critical inputs like revenue growth, WACC, and tax rates (highlighted cells).
- Step 4: Watch the DCF model update instantly as you tweak assumptions.
- Step 5: Analyze the outputs and use the results for investment decisions.
Why Choose This Calculator for New Gold Inc. (NGD)?
- Accuracy: Utilizes real New Gold financials to guarantee data precision.
- Flexibility: Tailored for users to easily adjust and experiment with inputs.
- Time-Saving: Avoid the complexities of constructing a DCF model from the ground up.
- Professional-Grade: Crafted with the expertise and usability expected at the CFO level.
- User-Friendly: Intuitive design ensures accessibility for users without extensive financial modeling skills.
Who Should Use This Product?
- Professional Investors: Develop comprehensive and accurate valuation models for analyzing New Gold Inc. (NGD) investments.
- Corporate Finance Teams: Evaluate valuation scenarios to inform strategic decisions within the organization.
- Consultants and Advisors: Deliver precise valuation insights to clients considering New Gold Inc. (NGD) stock.
- Students and Educators: Utilize real-time data to enhance learning and practice in financial modeling.
- Mining Industry Enthusiasts: Gain insights into how mining companies like New Gold Inc. (NGD) are valued in the market.
What the Template Contains
- Preloaded NGD Data: Historical and projected financial data, including revenue, EBIT, and capital expenditures.
- DCF and WACC Models: Professional-grade sheets for calculating intrinsic value and Weighted Average Cost of Capital.
- Editable Inputs: Yellow-highlighted cells for adjusting revenue growth, tax rates, and discount rates.
- Financial Statements: Comprehensive annual and quarterly financials for deeper analysis.
- Key Ratios: Profitability, leverage, and efficiency ratios to evaluate performance.
- Dashboard and Charts: Visual summaries of valuation outcomes and assumptions.
Disclaimer
All information, articles, and product details provided on this website are for general informational and educational purposes only. We do not claim any ownership over, nor do we intend to infringe upon, any trademarks, copyrights, logos, brand names, or other intellectual property mentioned or depicted on this site. Such intellectual property remains the property of its respective owners, and any references here are made solely for identification or informational purposes, without implying any affiliation, endorsement, or partnership.
We make no representations or warranties, express or implied, regarding the accuracy, completeness, or suitability of any content or products presented. Nothing on this website should be construed as legal, tax, investment, financial, medical, or other professional advice. In addition, no part of this site—including articles or product references—constitutes a solicitation, recommendation, endorsement, advertisement, or offer to buy or sell any securities, franchises, or other financial instruments, particularly in jurisdictions where such activity would be unlawful.
All content is of a general nature and may not address the specific circumstances of any individual or entity. It is not a substitute for professional advice or services. Any actions you take based on the information provided here are strictly at your own risk. You accept full responsibility for any decisions or outcomes arising from your use of this website and agree to release us from any liability in connection with your use of, or reliance upon, the content or products found herein.