
|
NIKE, Inc. (NKE): ANSOFF-Matrixanalyse |
Fully Editable: Tailor To Your Needs In Excel Or Sheets
Professional Design: Trusted, Industry-Standard Templates
Investor-Approved Valuation Models
MAC/PC Compatible, Fully Unlocked
No Expertise Is Needed; Easy To Follow
NIKE, Inc. (NKE) Bundle
Die strategische Roadmap von Nike stellt einen mutigen, vielschichtigen Ansatz zur globalen Marktbeherrschung vor, der digitale Innovation, geografische Expansion, Produktentwicklung und transformative Diversifizierung miteinander verbindet. Durch die sorgfältige Ausrichtung auf jeden Quadranten der Ansoff-Matrix verkauft der Sportriese nicht nur Produkte, sondern definiert die Schnittstelle zwischen Sport, Technologie und Verbrauchererlebnis neu. Von modernsten Leistungstechnologien bis hin zur Durchdringung neuer Märkte verspricht die Strategie von Nike, das sportliche Engagement in einer zunehmend dynamischen globalen Landschaft neu zu definieren.
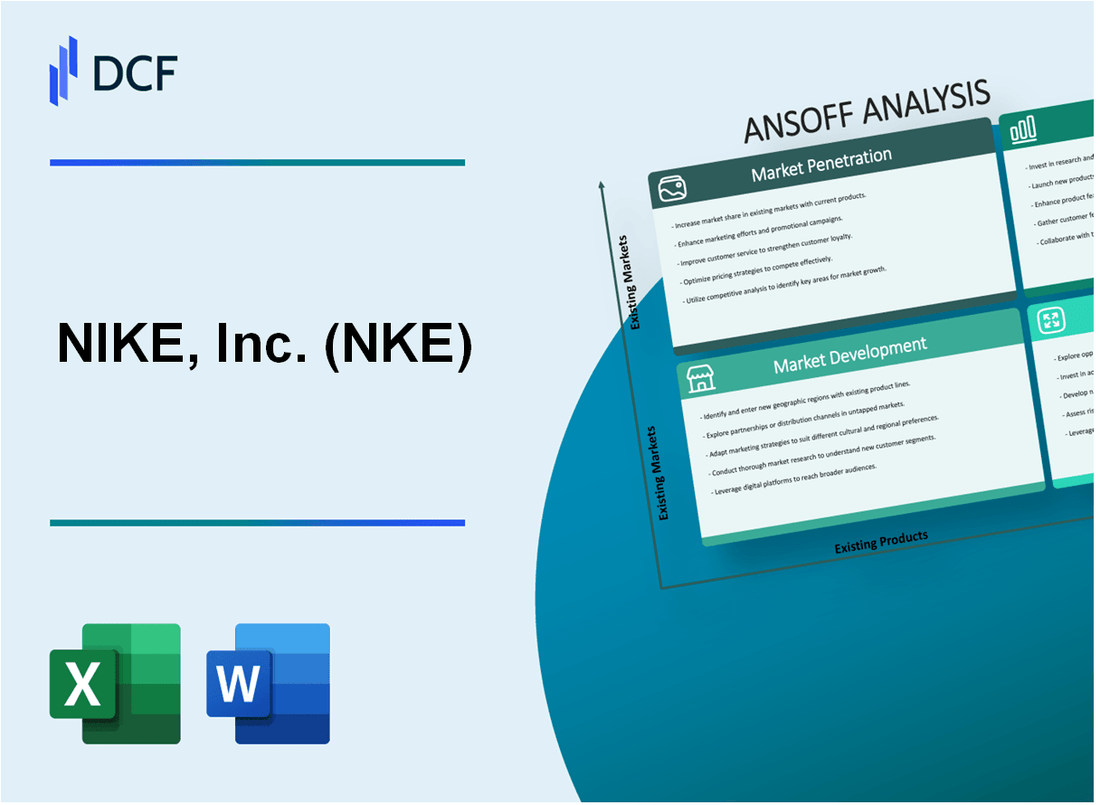
NIKE, Inc. (NKE) – Ansoff-Matrix: Marktdurchdringung
Erweitern Sie digitale Marketingkampagnen
Nike gab im Geschäftsjahr 2022 3,4 Milliarden US-Dollar für Marketing- und Vertriebskosten aus. Digitale Marketingkampagnen generierten 35 % des gesamten Markenengagements. Der Instagram-Account von Nike erreichte im Jahr 2022 156 Millionen Follower.
| Digitaler Kanal | Engagement-Rate | Jährliche Reichweite |
|---|---|---|
| 4.2% | 156 Millionen Follower | |
| TikTok | 3.7% | 98 Millionen Follower |
| YouTube | 2.9% | 76 Millionen Abonnenten |
Starten Sie gezielte Werbeaktionen und Treueprogramme
Das Nike-Mitgliedschaftsprogramm erreichte im Jahr 2022 404 Millionen Mitglieder. Mitglieder des Treueprogramms generieren 3,5-mal mehr Umsatz im Vergleich zu Nichtmitgliedern.
Verbessern Sie den Direktverkauf an den Verbraucher
Nike.com und die mobile Nike-App erwirtschafteten im Geschäftsjahr 2022 einen Direktumsatz von 18,7 Milliarden US-Dollar, was 39 % des Gesamtumsatzes des Unternehmens entspricht.
| Vertriebskanal | Jahresumsatz | Prozentsatz des Gesamtumsatzes |
|---|---|---|
| Nike.com | 12,4 Milliarden US-Dollar | 26% |
| Nike Mobile-App | 6,3 Milliarden US-Dollar | 13% |
Erhöhen Sie die Präsenz im Einzelhandelsgeschäft
Nike betreibt im Jahr 2022 weltweit 1.049 eigene Einzelhandelsgeschäfte. Der Umsatz der Einzelhandelsgeschäfte erreichte im Geschäftsjahr 2022 15,2 Milliarden US-Dollar.
Entwickeln Sie wettbewerbsfähige Preisstrategien
Die durchschnittliche Produktpreisspanne von Nike liegt zwischen 60 und 180 US-Dollar. Preissensible Segmente machen 27 % des gesamten Kundenstamms aus.
- Einstiegsprodukte: 50–80 $
- Mittelklasseprodukte: 80–120 $
- Premium-Produkte: 120–250 $
NIKE, Inc. (NKE) – Ansoff-Matrix: Marktentwicklung
Expandieren Sie in Schwellenländer
Der Umsatz von Nike in den Schwellenländern erreichte im Jahr 2022 5,4 Milliarden US-Dollar, was 27 % des gesamten internationalen Umsatzes entspricht. Indiens Sportschuhmarkt wurde im Jahr 2021 auf 2,1 Milliarden US-Dollar geschätzt, wobei Nike bis 2025 einen Marktanteil von 15 % anstrebt.
| Markt | Marktpotenzial | Nikes Investition |
|---|---|---|
| Indien | Marktgröße: 2,1 Milliarden US-Dollar | 350 Millionen US-Dollar geplante Investition |
| Südostasien | 1,8-Milliarden-Dollar-Markt für Sportbekleidung | 275 Millionen US-Dollar regionales Expansionsbudget |
| Afrika | 500 Millionen US-Dollar potenzieller Markt | 150-Millionen-Dollar-Markteintrittsstrategie |
Entwickeln Sie regionalspezifische Produktlinien
Nike investierte im Jahr 2022 42 Millionen US-Dollar in die lokale Produktentwicklung für Schwellenländer.
- Indien: Cricket-spezifische Schuhlinie
- Südostasien: Leichte Performance-Bekleidung
- Afrika: Hitzebeständige Trainingsausrüstung
Erhöhen Sie das internationale Sponsoring
Das internationale Sponsoringbudget von Nike erreichte im Jahr 2022 275 Millionen US-Dollar, wobei 40 % auf Schwellenländer entfielen.
| Region | Sponsoring-Investitionen | Zielsport |
|---|---|---|
| Indien | 65 Millionen Dollar | Cricket, Fußball |
| Südostasien | 55 Millionen Dollar | Fußball, Badminton |
| Afrika | 35 Millionen Dollar | Fußball, Leichtathletik |
Richten Sie lokalisierte Vertriebsnetze ein
Nike expandierte im Jahr 2022 auf 350 neue Einzelhandelsstandorte in Schwellenländern und investierte 180 Millionen US-Dollar in die Vertriebsinfrastruktur.
Nutzen Sie E-Commerce-Plattformen
Der E-Commerce-Umsatz von Nike in den Schwellenländern wuchs um 35 % und erreichte im Jahr 2022 1,2 Milliarden US-Dollar. Die Investitionen in digitale Plattformen beliefen sich auf insgesamt 95 Millionen US-Dollar.
| Markt | E-Commerce-Wachstum | Investition in digitale Plattformen |
|---|---|---|
| Indien | 42 % Wachstum im Jahresvergleich | 35 Millionen Dollar |
| Südostasien | 38 % Wachstum im Jahresvergleich | 30 Millionen Dollar |
| Afrika | 25 % Wachstum im Jahresvergleich | 20 Millionen Dollar |
NIKE, Inc. (NKE) – Ansoff-Matrix: Produktentwicklung
Innovative Leistungstechnologien
NIKE investierte im Jahr 2022 2,7 Milliarden US-Dollar in Forschung und Entwicklung. Entwickelte die Nike Zoom Air-Technologie mit 40 % leichterer Dämpfung im Vergleich zu früheren Designs. Einführung der Flyknit-Technologie, die den Materialabfall bei der Herstellung um 60 % reduziert.
| Technologie | Leistungsverbesserung | Entwicklungskosten |
|---|---|---|
| Nike Zoom Air | 40 % verbesserte Dämpfung | 375 Millionen Dollar |
| Flyknit | 60 % Materialeffizienz | 425 Millionen Dollar |
Nachhaltige Produktlinien
Startete die Nike Move to Zero-Initiative mit 3,1 Milliarden US-Dollar für die nachhaltige Produktentwicklung. Im Jahr 2022 wurden 1,5 Milliarden Plastikflaschen zu Sportbekleidung recycelt.
- Der Einsatz nachhaltiger Materialien stieg im Jahr 2022 um 47 %
- Die CO2-Emissionen in der Fertigung wurden um 22 % reduziert
- 100 % erneuerbare Energie in 74 % der Nike-eigenen Einrichtungen
Intelligente Sportbekleidung
Entwickelte die Nike Adapt-Serie mit einer Investition von 250 Millionen US-Dollar. Entwickelte selbstschnürende Schuhe mit Bluetooth-Konnektivität und Integration mobiler Apps.
Spezialisierte Sportsammlungen
Entwickelte 17 spezialisierte Produktlinien für Nischensportsegmente. Erwirtschaftete im Jahr 2022 einen Umsatz von 1,2 Milliarden US-Dollar mit Spezialsammlungen.
Fortgeschrittene Materialforschung
Im Jahr 2022 wurden 675 Millionen US-Dollar für die Materialforschung und -entwicklung bereitgestellt. Eigene Materialien entwickelt, die das Produktgewicht um 35 % reduzieren.
| Forschungsbereich | Investition | Leistungsergebnis |
|---|---|---|
| Fortschrittliche Materialien | 675 Millionen Dollar | 35 % Gewichtsreduzierung |
NIKE, Inc. (NKE) – Ansoff-Matrix: Diversifikation
Entdecken Sie Partnerschaften mit Technologieunternehmen für digitale Fitnessplattformen
Nike erwarb Celect, eine Plattform für prädiktive Analysen, im August 2019 für einen nicht genannten Betrag. Im Jahr 2021 startete Nike die Nike Digital-Plattform und generierte einen digitalen Umsatz von 26,2 Milliarden US-Dollar, was 26 % des Gesamtumsatzes des Unternehmens entspricht.
| Digitale Plattform | Einnahmen | Jahr |
|---|---|---|
| Nike Digital | 26,2 Milliarden US-Dollar | 2021 |
Entwickeln Sie Wellness- und Gesundheits-Tracking-Produktökosysteme
Die Nike+ Run Club-App hat weltweit über 50 Millionen aktive Benutzer. Nike hat im März 2018 Invertex übernommen, ein KI-Technologieunternehmen, das sich auf 3D-Fußscans spezialisiert hat.
- Aktive Nutzer des Nike+ Run Club: 50 Millionen
- Investitionen in digitale Ökosysteme: 500 Millionen US-Dollar an Technologieakquisitionen
Investieren Sie in aufkommende Sport- und Fitnesstrends
Nike investierte zwischen 2019 und 2022 1,5 Milliarden US-Dollar in E-Sport- und virtuelle Fitnesstechnologien.
| Anlagekategorie | Betrag | Zeitraum |
|---|---|---|
| E-Sport und virtuelle Fitness | 1,5 Milliarden US-Dollar | 2019-2022 |
Kreieren Sie Lifestyle- und Freizeitkleidungslinien
Das Freizeitbekleidungssegment Nike Sportswear erwirtschaftete im Geschäftsjahr 2022 einen Umsatz von 10,3 Milliarden US-Dollar, was 35 % des gesamten Bekleidungsumsatzes entspricht.
Potenzielle Übernahme komplementärer Fitness- und Technologie-Startups
Nike hat RTFKT, ein auf virtuelle Sneaker spezialisiertes digitales Designstudio, im Dezember 2021 für geschätzte 200 bis 300 Millionen US-Dollar übernommen.
| Erwerb | Wert | Jahr |
|---|---|---|
| RTFKT | 200–300 Millionen US-Dollar | 2021 |
NIKE, Inc. (NKE) - Ansoff Matrix: Market Penetration
Market Penetration focuses on increasing market share within existing markets using existing products. For NIKE, Inc., this means driving more sales through its established channels and deepening engagement with its current customer base, especially given the recent revenue contraction.
Intensify NIKE Direct sales to reach a higher percentage of total revenue.
The push toward direct sales remains a core strategy, though recent results show headwinds. For the full fiscal year 2025, NIKE Direct revenues totaled $18.8 billion, representing a 13 percent decrease year-over-year on a reported basis. This contrasts with Wholesale revenues, which were $25.9 billion for the same period. The total revenue for NIKE, Inc. in fiscal year 2025 was $46.3 billion, a 10 percent decline from the prior year. The company has a long-term ambition, previously stated, to have e-commerce channels account for 40% of total revenue. In the most recent reported quarter, Q1 of fiscal year 2026 (ended August 31, 2025), NIKE Direct sales were $4.5 billion, down 4 percent, while Wholesale grew to $6.8 billion, up 7 percent.
| Metric | FY 2025 Full Year Amount | FY 2025 YoY Change (Reported) |
| Total Revenue | $46.3 billion | Down 10 percent |
| NIKE Direct Revenue | $18.8 billion | Down 13 percent |
| Wholesale Revenue | $25.9 billion | Down 7 percent |
You need to watch the channel mix closely; the recent decline in NIKE Direct revenue suggests the penetration strategy faced execution challenges in the latter half of fiscal 2025.
Increase digital membership benefits to boost repeat purchases in North America.
Digital engagement is tied directly to membership value, which is intended to drive repeat buying frequency and higher average order value. In North America specifically, during the first quarter of fiscal year 2026, Nike revenue grew 4% overall, but the Nike Direct segment within that region declined 3%. The company is actively working on improving the digital experience; for instance, in that same quarter, Nike Digital reduced the number of days offering site-wide promotions by more than 50%, aiming to increase the full-price product mix.
Run targeted campaigns to convert more casual wear consumers to performance gear.
While specific conversion rates from casual to performance gear are not public, market positioning data suggests a strong base to convert from. In the U.S. sneaker market, NIKE has a brand recognition rate of 96% among consumers. Furthermore, 65% of U.S. sneaker owners report liking the brand, and 58% actually own Nike products. In the specialized running footwear segment, NIKE saw the strongest growth among the Top 10 brands, climbing 35.4% year-over-year in dollar sales across all channels.
Optimize pricing and promotions to gain share from competitors in key footwear categories.
Gaining share involves aggressive pricing and promotion management, especially as gross margins have been pressured. For the full fiscal year 2025, gross margin decreased to 42.7 percent, driven by higher discounts and channel mix changes. In the U.S. sneaker market, which is projected to reach $25.6 billion in revenue by 2025, NIKE holds a 58% ownership share among consumers. In the broader total footwear market, NIKE held a 38.2% share in 2022, with 30% in the athletic footwear sub-segment. The focus on reducing discounts is a direct lever for pricing optimization.
Expand NIKE App reach to drive higher engagement and transaction frequency.
App reach is a key metric for driving direct connection. As of November 2025 estimates, approximately 33,333 people were downloading NIKE mobile apps on a daily basis, which is an increase compared to the 30-day moving average of 26,444 daily downloads. The company's family of apps, including the shopping app, SNKRS, and Training Club, are central to the direct-to-consumer experience.
- Estimated daily mobile app downloads (Nov 2025): 33,333.
- Nike's brand recognition in the U.S. market: 96%.
- Nike customer loyalty among current U.S. owners: 84%.
- Nike Digital sales decline in Q1 FY2026: 12%.
- Nike Digital promotion days reduced in Q1 FY2026: more than 50%.
Finance: review the impact of the 175-basis-point tariff headwind on Q2 2026 margin guidance by next Tuesday.
NIKE, Inc. (NKE) - Ansoff Matrix: Market Development
Market Development for NIKE, Inc. (NKE) involves taking existing products into new geographic territories or targeting new consumer segments with existing offerings. The focus here is on aggressive expansion and tailored market entry, especially as recent financial results show headwinds in established markets.
The overall picture for NIKE, Inc. (NKE) in Fiscal Year 2025, which ended May 31, 2025, showed total revenues of $46.3 billion, representing a 10 percent decrease on a reported basis compared to the prior year. This context underscores the necessity of successful Market Development initiatives to reignite top-line growth.
Here is a look at the recent performance of the key geographic segments targeted for development:
| Geographic Segment | FY 2025 Revenue (USD) | Year-over-Year Change (Reported) | FY 2025 % of Total Revenue |
| Europe, Middle East And Africa (EMEA) | $12.26 B | Down -9.92% | 27.44% |
| North America | $19.57 B | Down -8.52% | 43.82% |
| Greater China | $6.59 B | Down -12.71% | 14.74% |
| Asia Pacific And Latin America (APLA) | $6.25 B | Down -7.1% | 13.99% |
Aggressively grow the Greater China market, focusing on local sports and digital platforms.
The Greater China segment, a cornerstone of NIKE, Inc. (NKE)'s global strategy, experienced significant contraction in Fiscal Year 2025. Revenues for this region were $6.59 billion, a decrease of $959.00 million, or -12.71%, from Fiscal Year 2024. In the third quarter of Fiscal 2025, Greater China revenues were $1.7 billion, plunging 17 percent on a reported basis. This decline was evident across channels:
- NIKE Direct sales fell 11 percent in Q3 FY2025.
- NIKE Digital revenues slid 20 percent in Q3 FY2025.
- Wholesale performance weakened with an 18 percent year-over-year decline in Q3 FY2025.
Despite these near-term pressures, the region still delivered a pre-tax profit of $1.6 billion in FY2025. Management has indicated that wholesale revenue is expected to return to modest growth for fiscal 2026, though Nike Direct is not expected to return to growth in fiscal 2026.
Enter new emerging markets in Southeast Asia and Latin America with tailored product lines.
The Asia Pacific And Latin America (APLA) segment generated $6.25 billion in revenue for Fiscal Year 2025, a decrease of $478.00 million, or -7.1%, from the prior year. This segment includes emerging markets where NIKE, Inc. (NKE) sees potential for double-digit growth, despite currency risks. In Latin America specifically, the brand shifted its business model in key countries like Brazil, Argentina, Chile, and Uruguay to strategic distributor partnerships starting in 2020 to drive sustainable, profitable growth.
Expand the retail footprint in under-penetrated European cities through partner stores.
The Europe, Middle East And Africa (EMEA) segment recorded revenues of $12.26 billion in Fiscal Year 2025, down -9.92%, or $1.35 billion, from Fiscal Year 2024. While the overall segment faced a decline, North America and EMEA were noted as gaining momentum in Q1 of Fiscal 2025. The strategy involves expanding the physical presence, which is a key part of elevating the entire marketplace, though specific data on the number of new partner stores opened in under-penetrated European cities is not publicly itemized in recent reports.
Target older demographics (55+) with specialized comfort and walking shoe lines.
While NIKE, Inc. (NKE) acknowledges appealing to a broader age range, including selling 'comfortable options for older adults,' the primary growth drivers remain Millennials (ages 26-41) and Generation Z (ages 9-25). The company's focus on these younger demographics, who drive significant fitness-related spending, is central to its current strategy. There are no specific, itemized financial figures available for the revenue contribution or growth rate specifically attributable to the 55+ demographic or their specialized shoe lines for the 2025 fiscal year.
Increase focus on the women's apparel market in regions like the Middle East.
The Middle East is a high-potential market where NIKE, Inc. (NKE) is working to gain share. The broader Middle Eastern sportswear market was valued at $5 billion in 2020 and is projected to exceed $17 billion by 2028. Within this, women's sports clothing is a crucial category with significant growth potential. The sector is forecast to expand at a Compound Annual Growth Rate (CAGR) of 7 percent between 2021 and 2025. NIKE, Inc. (NKE) has previously introduced tailored products, such as the Nike Pro Women's Hijab, launched in December 2017, to inspire more women in the region to participate in sports, directly supporting growth in the women's apparel segment.
NIKE, Inc. (NKE) - Ansoff Matrix: Product Development
You're looking at how NIKE, Inc. plans to grow by launching new products into its existing markets, which is the Product Development quadrant of the Ansoff Matrix. This is happening while the company navigates a tough financial environment; for the full fiscal year 2025 ended May 31, 2025, total revenues were $46.3 billion, a 10% decline year-over-year.
The focus here is on innovation, both in sustainability and high-performance gear, which is a direct response to the 42.7% gross margin reported for the full year 2025, down 190 basis points from the prior year.
Here are the key product development thrusts NIKE, Inc. is executing:
- Launch new sustainable footwear lines, like the Move to Zero collection, across all markets.
- Introduce advanced digital services, such as personalized training and wellness apps.
- Develop new performance apparel using proprietary materials like Dri-FIT ADV.
- Expand the Jordan Brand into new sports categories beyond basketball, like golf and soccer.
- Create a new line of accessible, lower-priced running shoes for entry-level athletes.
The sustainability push under Move to Zero has concrete 2025 targets, showing the commitment to product material evolution:
- Achieve 0.5M tons less of greenhouse gas emissions.
- Increase use of environmentally preferred materials to 50% of all key materials: polyester, cotton, leather, and rubber.
- Divert 100% of waste from landfill in the extended supply chain, recycling at least 80% back into products.
- Target a 25% reduction of fresh water usage per kilogram in textile dyeing and finishing.
The company is also leaning into digital services, even as its direct digital channel faced headwinds. For the full fiscal year 2025, NIKE Brand Digital sales declined 20%, and in the fourth quarter, they fell 26%. Still, the introduction of personalized apps is meant to deepen consumer connection, a strategy that saw the Training Club app increase sales in China by 30% during the pandemic. The company is betting on these digital services to drive future engagement, despite the recent pullback in the digital channel.
Developing new performance apparel using proprietary materials like Dri-FIT ADV is central to leading with sport, a stated priority for CEO Elliott Hill. This innovation focus is vital when you see that the Jordan Brand, a major performance/lifestyle pillar, saw its revenue drop 16% in fiscal 2025 to $7.27 billion.
The Jordan Brand is explicitly looking to diversify its product offering. The 'Win Now' strategy positions it across five 'fields of play'-running, basketball, football, training, and sportswear-to leverage its heritage while expanding its reach beyond just basketball footwear.
The need for accessible products is underscored by the financial reality of increased discounting. For the full year 2025, the gross margin fell to 42.7%, and in Q4, it was 40.3%. This margin pressure, which the company attributed partly to increased discounts, suggests a strategic opening for lower-priced running shoes to capture entry-level athletes without relying on deep markdowns across the premium lines.
Here's a quick look at the financial context for NIKE, Inc. in fiscal 2025:
| Metric | Amount/Value | Context |
| Full Year Revenue (FY2025) | $46.3 billion | Down 10% reported vs. prior year |
| Full Year Net Income (FY2025) | $3.2 billion | Down 44% from prior year |
| Full Year EPS (FY2025) | $2.16 | 42% decline from prior year |
| Jordan Brand Revenue (FY2025) | $7.27 billion | 16% drop year-over-year |
| Nike Direct Revenue (FY2025) | $18.8 billion | Down 13% reported |
| Shareholder Returns (FY2025) | $5.3 billion | Total dividends of $2.3 billion and repurchases of $3.0 billion |
The company is also investing heavily in brand relevance to support these new products. Annual demand creation costs rose by 9% for the full year 2025, with Q4 marketing expenditures increasing by 15%. This spend is intended to reinforce the connection to sport and performance, which is the foundation for launching any new product line, from sustainable footwear to the next generation of Dri-FIT ADV apparel.
Finance: finalize the inventory valuation adjustment based on the Q4 gross margin of 40.3% by next Tuesday.
NIKE, Inc. (NKE) - Ansoff Matrix: Diversification
You're looking at how NIKE, Inc. might expand beyond its core footwear and apparel business, which saw total annual revenue of approximately $46.309 billion for fiscal year 2025, a reported decline of 9.84% from fiscal year 2024's $51.362 billion.
Diversification means moving into new product/new market spaces. Here's a look at the potential financial and statistical anchors for those moves.
Acquire a niche fitness technology company to integrate advanced biometric tracking into products
This move targets the rapidly growing digital health space. The global Smart Fitness Market is estimated to reach $18.6 billion in 2025. Furthermore, the broader Interactive Fitness Market size was calculated at $6.22 billion in 2025. This contrasts with NIKE, Inc.'s own NIKE Direct revenues, which stood at $21.5 billion in fiscal 2024, showing the scale of the digital channel NIKE, Inc. already commands.
Launch a premium, subscription-based athletic recovery and physical therapy service
Moving into services taps into recurring revenue streams. For context, NIKE Direct revenues for the fourth quarter of fiscal 2024 were $5.1 billion, though NIKE Brand Digital sales declined by 10 percent in that same quarter. A premium service would need to generate significant monthly recurring revenue to offset any softness in the digital product sales channel.
Enter the eSports apparel and merchandise market with dedicated team sponsorships
While direct eSports revenue figures for NIKE, Inc. aren't public, consider the scale of their existing apparel business. In fiscal 2024, NIKE Brand wholesale revenues were approximately $27.8 billion. The company has a history of major sports sponsorships, such as providing uniforms for clubs like FC Barcelona and Paris Saint-Germain.
Develop a line of smart home fitness equipment that integrates with the NIKE ecosystem
This is a direct play into connected hardware. The home fitness equipment market was valued at $11.6 billion in 2023. The Smart Fitness sector, which this falls under, is projected to grow to $59.8 billion by 2035 from its 2025 estimate of $18.6 billion, showing a 12.3% Compound Annual Growth Rate (CAGR).
Invest in a minority stake in a sustainable materials startup to secure future supply chain
This strategy supports long-term cost control and brand equity. In 2024, 24 percent of NIKE, Inc.'s product materials came from recycled or renewable sources. The company used 183,619 metric tons of polyester by volume last year, with two-thirds of that being recycled. The goal is to reach 50 percent "environmentally preferred" materials for 2025, up from 48 percent achieved last year.
Here's a snapshot of the material goals and current standing:
| Metric | Value/Target | Year/Context |
| Environmentally Preferred Materials Achieved | 48 percent | Last Year |
| Environmentally Preferred Materials Target | 50 percent | 2025 Goal |
| Recycled/Renewable Sources in Product Materials | 24 percent | 2024 |
| Polyester Volume Used (Metric Tons) | 183,619 | Last Year |
| Recycled Polyester Share of Volume | Two-thirds | Last Year |
The investment in a startup like one focused on textile-to-textile recycling helps secure supply for materials that currently account for a significant portion of the carbon footprint. Raw materials accounted for 34 percent of the company's carbon footprint in 2024.
You should review the capital allocation plan for Q1 FY25 to see if any specific M&A budget has been earmarked for these new ventures.
Disclaimer
All information, articles, and product details provided on this website are for general informational and educational purposes only. We do not claim any ownership over, nor do we intend to infringe upon, any trademarks, copyrights, logos, brand names, or other intellectual property mentioned or depicted on this site. Such intellectual property remains the property of its respective owners, and any references here are made solely for identification or informational purposes, without implying any affiliation, endorsement, or partnership.
We make no representations or warranties, express or implied, regarding the accuracy, completeness, or suitability of any content or products presented. Nothing on this website should be construed as legal, tax, investment, financial, medical, or other professional advice. In addition, no part of this site—including articles or product references—constitutes a solicitation, recommendation, endorsement, advertisement, or offer to buy or sell any securities, franchises, or other financial instruments, particularly in jurisdictions where such activity would be unlawful.
All content is of a general nature and may not address the specific circumstances of any individual or entity. It is not a substitute for professional advice or services. Any actions you take based on the information provided here are strictly at your own risk. You accept full responsibility for any decisions or outcomes arising from your use of this website and agree to release us from any liability in connection with your use of, or reliance upon, the content or products found herein.