
|
Nikola Corporation (NKLA) DCF -Bewertung |
Fully Editable: Tailor To Your Needs In Excel Or Sheets
Professional Design: Trusted, Industry-Standard Templates
Investor-Approved Valuation Models
MAC/PC Compatible, Fully Unlocked
No Expertise Is Needed; Easy To Follow
Nikola Corporation (NKLA) Bundle
Unser DCF-Taschenrechner von Nikola Corporation (NKLA) für die Genauigkeit ermöglicht es Ihnen, die Bewertung von Nikola mithilfe realer Finanzdaten zu bewerten und vollständige Flexibilität zu bieten, um alle wesentlichen Parameter für verbesserte Projektionen zu ändern.
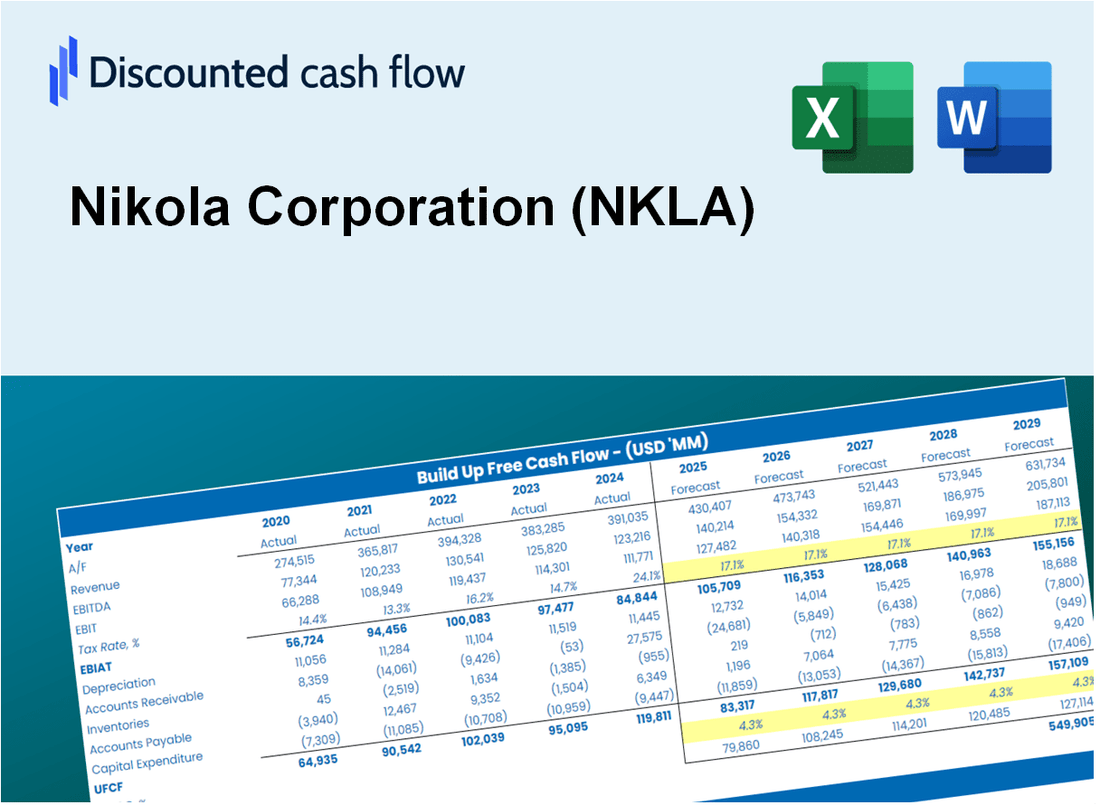
Discounted Cash Flow (DCF) - (USD MM)
| Year | AY1 2019 |
AY2 2020 |
AY3 2021 |
AY4 2022 |
AY5 2023 |
FY1 2024 |
FY2 2025 |
FY3 2026 |
FY4 2027 |
FY5 2028 |
|---|---|---|---|---|---|---|---|---|---|---|
| Revenue | .5 | .1 | .1 | 50.8 | 35.8 | 35.0 | 34.1 | 33.3 | 32.5 | 31.7 |
| Revenue Growth, % | 0 | -80.29 | 0 | 53400 | -29.49 | -2.44 | -2.44 | -2.44 | -2.44 | -2.44 |
| EBITDA | -85.7 | -362.3 | -685.3 | -677.0 | -736.3 | -35.0 | -34.1 | -33.3 | -32.5 | -31.7 |
| EBITDA, % | -17774.27 | -381381.05 | -721363.16 | -1332 | -2054.4 | -100 | -100 | -100 | -100 | -100 |
| Depreciation | 2.3 | 6.0 | 8.2 | 22.8 | 35.9 | 31.1 | 30.3 | 29.6 | 28.9 | 28.2 |
| Depreciation, % | 481.95 | 6324.21 | 8664.21 | 44.79 | 100.14 | 88.96 | 88.96 | 88.96 | 88.96 | 88.96 |
| EBIT | -88.0 | -368.3 | -693.5 | -699.8 | -772.2 | -35.0 | -34.1 | -33.3 | -32.5 | -31.7 |
| EBIT, % | -18256.22 | -387705.26 | -730027.37 | -1376.79 | -2154.55 | -100 | -100 | -100 | -100 | -100 |
| Total Cash | 85.7 | 840.9 | 497.2 | 233.4 | 466.4 | 35.0 | 34.1 | 33.3 | 32.5 | 31.7 |
| Total Cash, percent | .0 | .9 | .5 | .0 | .0 | .0 | .0 | .0 | .0 | .0 |
| Account Receivables | .7 | .0 | .0 | 31.6 | 27.2 | 16.7 | 16.2 | 15.8 | 15.5 | 15.1 |
| Account Receivables, % | 136.51 | 0 | 0 | 62.25 | 75.89 | 47.63 | 47.63 | 47.63 | 47.63 | 47.63 |
| Inventories | 1.9 | .0 | 11.6 | 123.2 | 62.6 | 28.0 | 27.3 | 26.6 | 26.0 | 25.3 |
| Inventories, % | 388.38 | 0 | 12207.37 | 242.39 | 174.64 | 80 | 80 | 80 | 80 | 80 |
| Accounts Payable | 5.1 | 29.4 | 87.0 | 93.2 | 44.1 | 35.0 | 34.1 | 33.3 | 32.5 | 31.7 |
| Accounts Payable, % | 1060.79 | 30909.47 | 91560 | 183.46 | 123.14 | 100 | 100 | 100 | 100 | 100 |
| Capital Expenditure | -39.3 | -22.3 | -179.3 | -170.7 | -120.5 | -35.0 | -34.1 | -33.3 | -32.5 | -31.7 |
| Capital Expenditure, % | -8153.94 | -23498.95 | -188704.21 | -335.91 | -336.27 | -100 | -100 | -100 | -100 | -100 |
| Tax Rate, % | -13.92 | -13.92 | -13.92 | -13.92 | -13.92 | -13.92 | -13.92 | -13.92 | -13.92 | -13.92 |
| EBITAT | -88.1 | -367.3 | -693.5 | -699.8 | -879.7 | -34.9 | -34.1 | -33.3 | -32.4 | -31.7 |
| Depreciation | ||||||||||
| Changes in Account Receivables | ||||||||||
| Changes in Inventories | ||||||||||
| Changes in Accounts Payable | ||||||||||
| Capital Expenditure | ||||||||||
| UFCF | -122.5 | -356.9 | -818.5 | -984.7 | -948.4 | -2.8 | -37.6 | -36.7 | -35.8 | -34.9 |
| WACC, % | 26.19 | 26.12 | 26.19 | 26.19 | 26.19 | 26.17 | 26.17 | 26.17 | 26.17 | 26.17 |
| PV UFCF | ||||||||||
| SUM PV UFCF | -69.2 | |||||||||
| Long Term Growth Rate, % | 2.00 | |||||||||
| Free cash flow (T + 1) | -36 | |||||||||
| Terminal Value | -147 | |||||||||
| Present Terminal Value | -46 | |||||||||
| Enterprise Value | -115 | |||||||||
| Net Debt | -180 | |||||||||
| Equity Value | 65 | |||||||||
| Diluted Shares Outstanding, MM | 27 | |||||||||
| Equity Value Per Share | 2.42 |
What You Will Get
- Real NKLA Financials: Access to historical and projected data for precise valuation.
- Customizable Inputs: Adjust WACC, tax rates, revenue growth, and capital expenditures as needed.
- Automated Calculations: Dynamic computation of intrinsic value and NPV.
- Scenario Analysis: Explore various scenarios to assess Nikola's future performance.
- User-Friendly Design: Designed for professionals while remaining approachable for newcomers.
Key Features
- Comprehensive DCF Model: Features detailed unlevered and levered DCF valuation frameworks.
- WACC Analysis Tool: Pre-configured Weighted Average Cost of Capital sheet with adjustable parameters.
- Customizable Forecast Inputs: Adjust growth projections, capital investments, and discount rates as needed.
- Integrated Financial Ratios: Assess profitability, leverage, and operational efficiency ratios for Nikola Corporation (NKLA).
- Interactive Dashboard and Visuals: Graphical representations highlight essential valuation metrics for straightforward analysis.
How It Works
- Download: Obtain the pre-formatted Excel file containing Nikola Corporation's (NKLA) financial data.
- Customize: Modify projections, including sales growth, EBITDA %, and WACC.
- Update Automatically: The intrinsic value and NPV calculations refresh in real-time.
- Test Scenarios: Generate various forecasts and analyze results instantly.
- Make Decisions: Leverage the valuation outcomes to inform your investment approach.
Why Choose Nikola Corporation (NKLA)?
- Innovative Technology: Pioneering advancements in electric and hydrogen fuel cell vehicles.
- Sustainable Practices: Commitment to eco-friendly solutions and reducing carbon footprints.
- Strong Partnerships: Collaborations with industry leaders to enhance product offerings and market reach.
- Market Potential: Positioned in a rapidly growing sector with significant future demand.
- Expert Leadership: Guided by a team with extensive experience in automotive and energy sectors.
Who Should Use Nikola Corporation (NKLA)?
- Investors: Make informed investment choices with insights from a leading electric vehicle manufacturer.
- Financial Analysts: Streamline your analysis with comprehensive data on Nikola's market performance.
- Consultants: Easily tailor presentations and reports to showcase Nikola's innovative solutions.
- Automotive Enthusiasts: Enhance your knowledge of cutting-edge technology in the electric vehicle sector.
- Educators and Students: Utilize Nikola's business model as a case study in sustainability and innovation.
What the Template Contains
- Pre-Filled DCF Model: Nikola Corporation’s (NKLA) financial data preloaded for immediate use.
- WACC Calculator: Detailed calculations for Weighted Average Cost of Capital.
- Financial Ratios: Evaluate Nikola Corporation’s (NKLA) profitability, leverage, and efficiency.
- Editable Inputs: Change assumptions such as growth, margins, and CAPEX to fit your scenarios.
- Financial Statements: Annual and quarterly reports to support detailed analysis.
- Interactive Dashboard: Easily visualize key valuation metrics and results.
Disclaimer
All information, articles, and product details provided on this website are for general informational and educational purposes only. We do not claim any ownership over, nor do we intend to infringe upon, any trademarks, copyrights, logos, brand names, or other intellectual property mentioned or depicted on this site. Such intellectual property remains the property of its respective owners, and any references here are made solely for identification or informational purposes, without implying any affiliation, endorsement, or partnership.
We make no representations or warranties, express or implied, regarding the accuracy, completeness, or suitability of any content or products presented. Nothing on this website should be construed as legal, tax, investment, financial, medical, or other professional advice. In addition, no part of this site—including articles or product references—constitutes a solicitation, recommendation, endorsement, advertisement, or offer to buy or sell any securities, franchises, or other financial instruments, particularly in jurisdictions where such activity would be unlawful.
All content is of a general nature and may not address the specific circumstances of any individual or entity. It is not a substitute for professional advice or services. Any actions you take based on the information provided here are strictly at your own risk. You accept full responsibility for any decisions or outcomes arising from your use of this website and agree to release us from any liability in connection with your use of, or reliance upon, the content or products found herein.