
|
NN, Inc. (NNBR) DCF -Bewertung |
Fully Editable: Tailor To Your Needs In Excel Or Sheets
Professional Design: Trusted, Industry-Standard Templates
Investor-Approved Valuation Models
MAC/PC Compatible, Fully Unlocked
No Expertise Is Needed; Easy To Follow
NN, Inc. (NNBR) Bundle
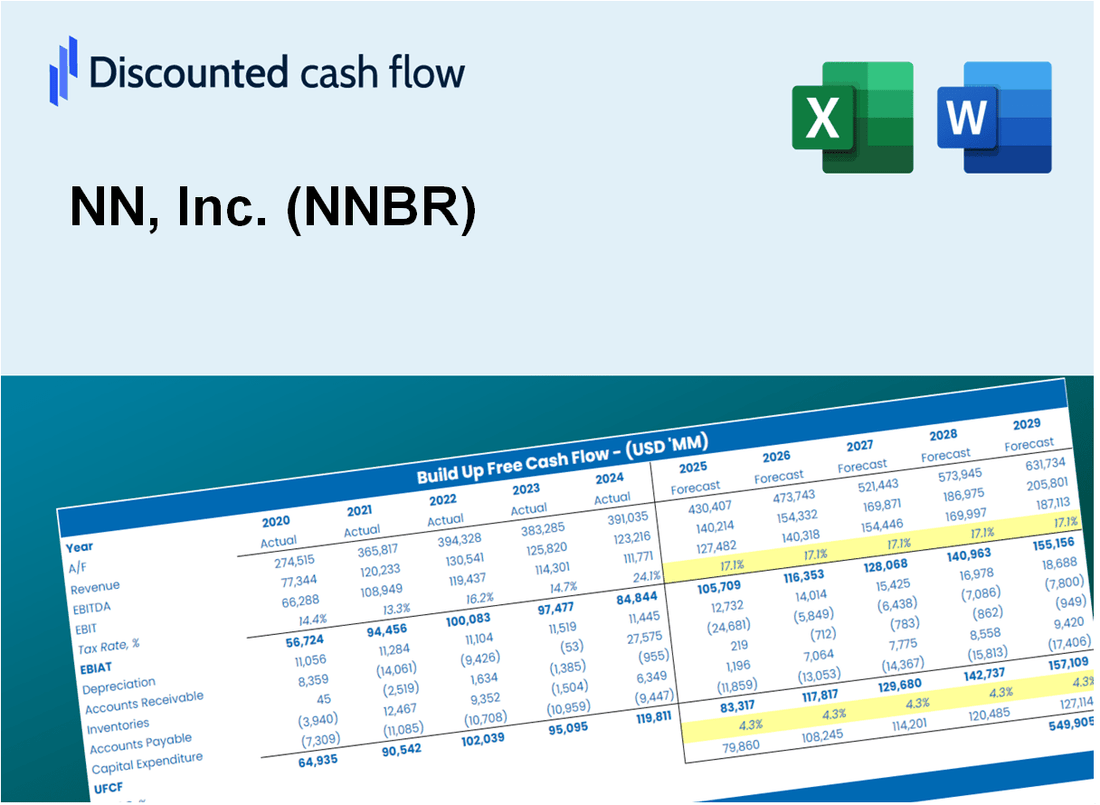
Als Anleger oder Analyst ist der (NNBR) DCF-Taschenrechner Ihre Anlaufstelle für eine genaue Bewertung. Mit realen Daten von NN, Inc. geladen, können Sie problemlos Prognosen anpassen und die Effekte in Echtzeit beobachten.
What You Will Receive
- Comprehensive Financial Model: NN, Inc.'s (NNBR) real data facilitates accurate DCF valuation.
- Complete Forecasting Control: Modify revenue growth, profit margins, WACC, and other critical factors.
- Real-Time Calculations: Automatic updates provide immediate results as adjustments are made.
- Professional-Grade Template: A polished Excel file crafted for high-quality valuation presentations.
- Flexible and Reusable: Designed for adaptability, allowing for repeated use in thorough forecasting.
Key Features
- 🔍 Real-Life NNBR Financials: Pre-filled historical and projected data for NN, Inc.
- ✏️ Fully Customizable Inputs: Adjust all critical parameters (yellow cells) like WACC, growth %, and tax rates.
- 📊 Professional DCF Valuation: Built-in formulas calculate NN, Inc.’s intrinsic value using the Discounted Cash Flow method.
- ⚡ Instant Results: Visualize NN, Inc.’s valuation instantly after making changes.
- Scenario Analysis: Test and compare outcomes for various financial assumptions side-by-side.
How It Works
- Download the Template: Gain immediate access to the Excel-based NN, Inc. (NNBR) DCF Calculator.
- Input Your Assumptions: Modify the yellow-highlighted cells for growth rates, WACC, margins, and more.
- Instant Calculations: The model automatically recalculates NN, Inc.'s (NNBR) intrinsic value.
- Test Scenarios: Experiment with various assumptions to assess potential valuation shifts.
- Analyze and Decide: Utilize the findings to inform your investment or financial analysis.
Why Choose NN, Inc. (NNBR) Calculator?
- Comprehensive Tool: Offers DCF, WACC, and financial ratio analyses all in one convenient package.
- Customizable Inputs: Modify yellow-highlighted cells to explore different financial scenarios.
- Detailed Insights: Automatically computes NN, Inc.’s intrinsic value and Net Present Value.
- Preloaded Data: Includes historical and forecasted data for precise starting points.
- Professional Quality: Perfect for financial analysts, investors, and business consultants.
Who Should Use NN, Inc. (NNBR)?
- Professional Investors: Develop comprehensive and accurate valuation models for investment assessments.
- Corporate Finance Teams: Evaluate valuation scenarios to inform strategic decision-making.
- Consultants and Advisors: Deliver precise valuation insights for NN, Inc. (NNBR) to clients.
- Students and Educators: Utilize real-world data to practice and instruct financial modeling techniques.
- Industry Analysts: Gain insights into how companies like NN, Inc. (NNBR) are valued within their sectors.
What the Template Contains
- Pre-Filled DCF Model: NN, Inc.'s (NNBR) financial data preloaded for immediate use.
- WACC Calculator: Detailed calculations for Weighted Average Cost of Capital.
- Financial Ratios: Evaluate NN, Inc.'s (NNBR) profitability, leverage, and efficiency.
- Editable Inputs: Change assumptions such as growth, margins, and CAPEX to fit your scenarios.
- Financial Statements: Annual and quarterly reports to support detailed analysis.
- Interactive Dashboard: Easily visualize key valuation metrics and results.
Disclaimer
All information, articles, and product details provided on this website are for general informational and educational purposes only. We do not claim any ownership over, nor do we intend to infringe upon, any trademarks, copyrights, logos, brand names, or other intellectual property mentioned or depicted on this site. Such intellectual property remains the property of its respective owners, and any references here are made solely for identification or informational purposes, without implying any affiliation, endorsement, or partnership.
We make no representations or warranties, express or implied, regarding the accuracy, completeness, or suitability of any content or products presented. Nothing on this website should be construed as legal, tax, investment, financial, medical, or other professional advice. In addition, no part of this site—including articles or product references—constitutes a solicitation, recommendation, endorsement, advertisement, or offer to buy or sell any securities, franchises, or other financial instruments, particularly in jurisdictions where such activity would be unlawful.
All content is of a general nature and may not address the specific circumstances of any individual or entity. It is not a substitute for professional advice or services. Any actions you take based on the information provided here are strictly at your own risk. You accept full responsibility for any decisions or outcomes arising from your use of this website and agree to release us from any liability in connection with your use of, or reliance upon, the content or products found herein.