
|
NRX Pharmaceuticals, Inc. (NRXP) DCF -Bewertung |
Fully Editable: Tailor To Your Needs In Excel Or Sheets
Professional Design: Trusted, Industry-Standard Templates
Investor-Approved Valuation Models
MAC/PC Compatible, Fully Unlocked
No Expertise Is Needed; Easy To Follow
NRx Pharmaceuticals, Inc. (NRXP) Bundle
Vereinfachen Sie die Bewertung von NRX Pharmaceuticals, Inc. (NRXP) mit diesem anpassbaren DCF -Taschenrechner! Mit Real NRX Pharmaceuticals, Inc. (NRXP) -Befinanzierungen und einstellbaren Prognoseeingaben können Sie Szenarien testen und NRX Pharmaceuticals, Inc. (NRXP) in Minuten aufdecken.
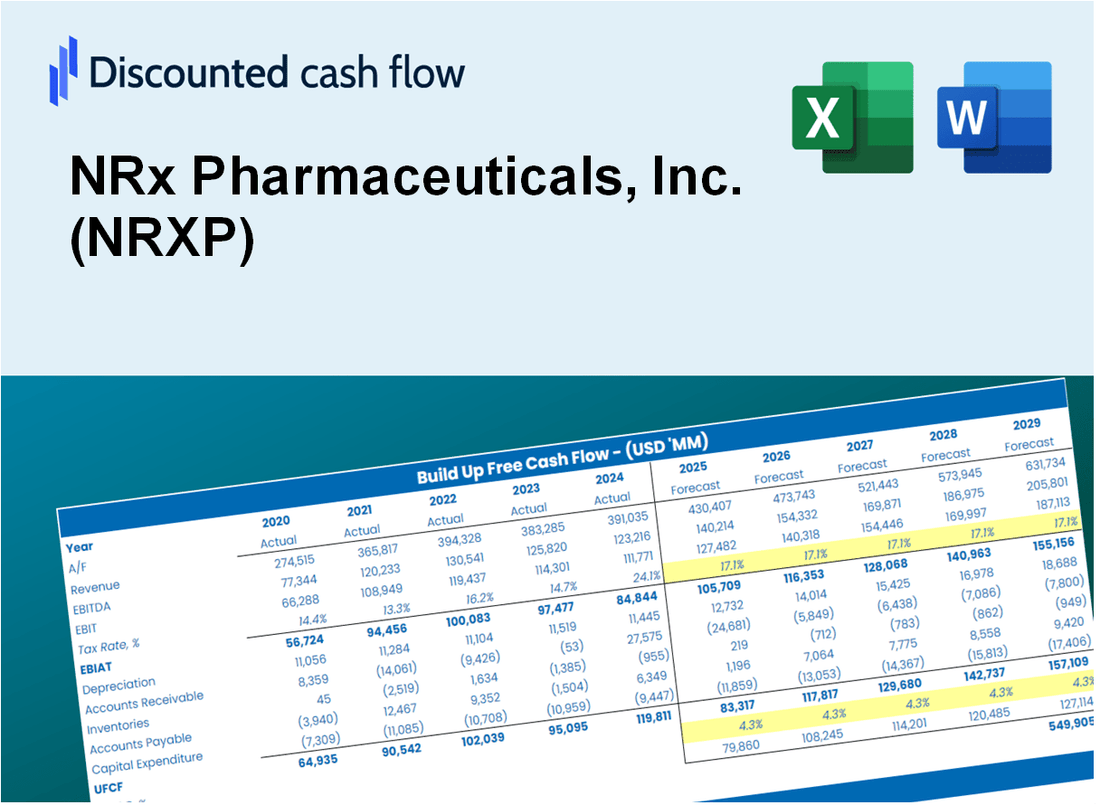
Discounted Cash Flow (DCF) - (USD MM)
| Year | AY1 2020 |
AY2 2021 |
AY3 2022 |
AY4 2023 |
AY5 2024 |
FY1 2025 |
FY2 2026 |
FY3 2027 |
FY4 2028 |
FY5 2029 |
|---|---|---|---|---|---|---|---|---|---|---|
| Revenue | .0 | .0 | .0 | .0 | .0 | .0 | .0 | .0 | .0 | .0 |
| Revenue Growth, % | 0 | 0 | 0 | 0 | 0 | 0 | 0 | 0 | 0 | 0 |
| EBITDA | -51.7 | -93.0 | -39.8 | -30.0 | -24.0 | .0 | .0 | .0 | .0 | .0 |
| EBITDA, % | 100 | 100 | 100 | 100 | 100 | 100 | 100 | 100 | 100 | 100 |
| Depreciation | .0 | .0 | .0 | .0 | .0 | .0 | .0 | .0 | .0 | .0 |
| Depreciation, % | 100 | 100 | 100 | 100 | 100 | 100 | 100 | 100 | 100 | 100 |
| EBIT | -51.7 | -93.0 | -39.8 | -30.0 | -24.0 | .0 | .0 | .0 | .0 | .0 |
| EBIT, % | 100 | 100 | 100 | 100 | 100 | 100 | 100 | 100 | 100 | 100 |
| Total Cash | 1.9 | 27.6 | 20.1 | 4.6 | 1.4 | .0 | .0 | .0 | .0 | .0 |
| Total Cash, percent | .0 | .0 | .0 | .0 | .0 | .0 | .0 | .0 | .0 | .0 |
| Account Receivables | .8 | .0 | .0 | .0 | .0 | .0 | .0 | .0 | .0 | .0 |
| Account Receivables, % | 100 | 100 | 100 | 100 | 100 | 100 | 100 | 100 | 100 | 100 |
| Inventories | .2 | .0 | .0 | .0 | .0 | .0 | .0 | .0 | .0 | .0 |
| Inventories, % | 100 | 100 | 100 | 100 | 100 | 100 | 100 | 100 | 100 | 100 |
| Accounts Payable | 3.2 | 3.7 | 2.1 | 4.6 | 4.1 | .0 | .0 | .0 | .0 | .0 |
| Accounts Payable, % | 100 | 100 | 100 | 100 | 100 | 100 | 100 | 100 | 100 | 100 |
| Capital Expenditure | .0 | .0 | .0 | .0 | .0 | .0 | .0 | .0 | .0 | .0 |
| Capital Expenditure, % | 100 | 100 | 100 | 100 | 100 | 0 | 0 | 0 | 0 | 0 |
| Tax Rate, % | 0 | 0 | 0 | 0 | 0 | 0 | 0 | 0 | 0 | 0 |
| EBITAT | -51.7 | -93.0 | -39.8 | -30.0 | -24.0 | .0 | .0 | .0 | .0 | .0 |
| Depreciation | ||||||||||
| Changes in Account Receivables | ||||||||||
| Changes in Inventories | ||||||||||
| Changes in Accounts Payable | ||||||||||
| Capital Expenditure | ||||||||||
| UFCF | -49.6 | -91.5 | -41.4 | -27.5 | -24.5 | -4.1 | .0 | .0 | .0 | .0 |
| WACC, % | 13.45 | 13.45 | 13.45 | 13.45 | 13.45 | 13.45 | 13.45 | 13.45 | 13.45 | 13.45 |
| PV UFCF | ||||||||||
| SUM PV UFCF | -3.6 | |||||||||
| Long Term Growth Rate, % | 2.00 | |||||||||
| Free cash flow (T + 1) | 0 | |||||||||
| Terminal Value | 0 | |||||||||
| Present Terminal Value | 0 | |||||||||
| Enterprise Value | -4 | |||||||||
| Net Debt | 5 | |||||||||
| Equity Value | -9 | |||||||||
| Diluted Shares Outstanding, MM | 11 | |||||||||
| Equity Value Per Share | -0.83 |
What You Will Get
- Real NRXP Financials: Access to historical and projected data for precise valuation.
- Customizable Inputs: Adjust WACC, tax rates, revenue growth, and capital expenditures as needed.
- Dynamic Calculations: Intrinsic value and NPV are computed in real-time.
- Scenario Analysis: Explore various scenarios to assess NRx Pharmaceuticals' future performance.
- User-Friendly Design: Designed for professionals while remaining approachable for newcomers.
Key Features
- Comprehensive Financial Data: Gain access to precise historical data and forward-looking projections for NRx Pharmaceuticals, Inc. (NRXP).
- Adjustable Forecast Parameters: Modify highlighted cells for key metrics such as WACC, growth rates, and profit margins.
- Real-Time Calculations: Enjoy automatic updates for DCF, Net Present Value (NPV), and cash flow assessments.
- User-Friendly Dashboard: Engage with intuitive charts and summaries to clearly present your valuation findings.
- Designed for All Skill Levels: A straightforward and accessible layout tailored for investors, CFOs, and consultants alike.
How It Works
- Step 1: Download the Excel file.
- Step 2: Review NRx Pharmaceuticals, Inc.'s (NRXP) pre-filled financial data and forecasts.
- Step 3: Modify key inputs such as revenue growth, WACC, and tax rates (highlighted cells).
- Step 4: Observe the DCF model update in real-time as you adjust your assumptions.
- Step 5: Evaluate the outputs and leverage the results for your investment strategies.
Why Choose NRx Pharmaceuticals, Inc. (NRXP)?
- Innovative Solutions: Cutting-edge therapies designed to meet unmet medical needs.
- Scientific Excellence: Backed by rigorous research and clinical trials ensuring efficacy and safety.
- Patient-Centric Approach: Focused on improving patient outcomes and quality of life.
- Experienced Team: Led by industry experts with a proven track record in pharmaceuticals.
- Commitment to Growth: Dedicated to expanding our pipeline and advancing healthcare solutions.
Who Should Use NRx Pharmaceuticals, Inc. (NRXP)?
- Pharmaceutical Students: Explore drug development processes and apply theoretical knowledge to real-world scenarios.
- Researchers: Utilize advanced models in your studies related to pharmaceutical innovations and therapies.
- Investors: Evaluate your investment strategies and analyze valuation metrics for NRx Pharmaceuticals stock.
- Healthcare Analysts: Enhance your analysis with a customizable financial model tailored for the biotech sector.
- Entrepreneurs: Understand how large pharmaceutical companies like NRx Pharmaceuticals are assessed and valued in the market.
What the Template Contains
- Pre-Filled Data: Includes NRx Pharmaceuticals' historical financials and forecasts.
- Discounted Cash Flow Model: Editable DCF valuation model with automatic calculations.
- Weighted Average Cost of Capital (WACC): A dedicated sheet for calculating WACC based on custom inputs.
- Key Financial Ratios: Analyze NRx Pharmaceuticals' profitability, efficiency, and leverage.
- Customizable Inputs: Edit revenue growth, margins, and tax rates with ease.
- Clear Dashboard: Charts and tables summarizing key valuation results.
Disclaimer
All information, articles, and product details provided on this website are for general informational and educational purposes only. We do not claim any ownership over, nor do we intend to infringe upon, any trademarks, copyrights, logos, brand names, or other intellectual property mentioned or depicted on this site. Such intellectual property remains the property of its respective owners, and any references here are made solely for identification or informational purposes, without implying any affiliation, endorsement, or partnership.
We make no representations or warranties, express or implied, regarding the accuracy, completeness, or suitability of any content or products presented. Nothing on this website should be construed as legal, tax, investment, financial, medical, or other professional advice. In addition, no part of this site—including articles or product references—constitutes a solicitation, recommendation, endorsement, advertisement, or offer to buy or sell any securities, franchises, or other financial instruments, particularly in jurisdictions where such activity would be unlawful.
All content is of a general nature and may not address the specific circumstances of any individual or entity. It is not a substitute for professional advice or services. Any actions you take based on the information provided here are strictly at your own risk. You accept full responsibility for any decisions or outcomes arising from your use of this website and agree to release us from any liability in connection with your use of, or reliance upon, the content or products found herein.