
|
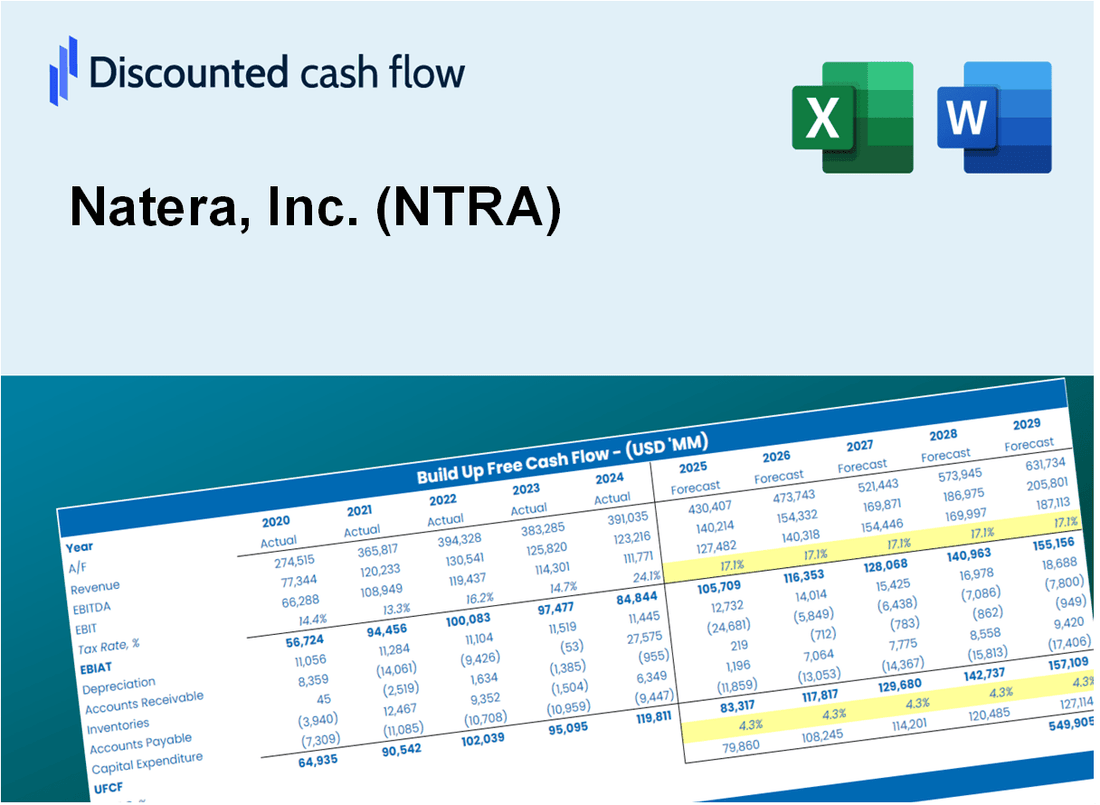
Natera, Inc. (NTRA) DCF -Bewertung |
Fully Editable: Tailor To Your Needs In Excel Or Sheets
Professional Design: Trusted, Industry-Standard Templates
Investor-Approved Valuation Models
MAC/PC Compatible, Fully Unlocked
No Expertise Is Needed; Easy To Follow
Natera, Inc. (NTRA) Bundle
Optimieren Sie Ihre Zeit und verbessern Sie die Präzision mit unserem [NTRA] DCF -Taschenrechner! Mit der Verwendung von Real Natera, Inc. Daten und anpassbaren Annahmen ermöglichen dieses Tool Sie, Natera, Inc. wie ein erfahrener Investor zu prognostizieren, zu analysieren und zu bewerten.
What You Will Get
- Real NTRA Financial Data: Pre-filled with Natera’s historical and projected data for precise analysis.
- Fully Editable Template: Modify key inputs like revenue growth, WACC, and EBITDA % with ease.
- Automatic Calculations: See Natera’s intrinsic value update instantly based on your changes.
- Professional Valuation Tool: Designed for investors, analysts, and consultants seeking accurate DCF results.
- User-Friendly Design: Simple structure and clear instructions for all experience levels.
Key Features
- Customizable Forecast Inputs: Adjust essential factors such as revenue growth, gross margin %, and R&D expenditures.
- Instant DCF Valuation: Quickly computes intrinsic value, NPV, and additional financial metrics.
- High-Precision Accuracy: Leverages Natera’s actual financial data for dependable valuation results.
- Effortless Scenario Analysis: Evaluate various assumptions and assess results with ease.
- Efficiency Booster: Remove the complexity of constructing intricate valuation models from the ground up.
How It Works
- Step 1: Download the Excel file for Natera, Inc. (NTRA).
- Step 2: Review Natera's pre-filled financial data and forecasts.
- Step 3: Modify key inputs such as revenue growth, WACC, and tax rates (highlighted cells).
- Step 4: Observe the DCF model update in real-time as you adjust assumptions.
- Step 5: Evaluate the outputs and leverage the results for your investment decisions.
Why Choose This Calculator?
- Accuracy: Utilizes real Natera financials to ensure data precision.
- Flexibility: Built for users to easily test and modify their inputs.
- Time-Saving: Eliminate the need to create a DCF model from the ground up.
- Professional-Grade: Crafted with the precision and usability expected at the CFO level.
- User-Friendly: Intuitive interface suitable for users without extensive financial modeling knowledge.
Who Should Use Natera, Inc. (NTRA)?
- Healthcare Professionals: Understand genetic testing methodologies and their applications in patient care.
- Researchers: Utilize Natera's data for studies related to genomics and precision medicine.
- Investors: Evaluate market potential and performance metrics of Natera, Inc. (NTRA) for informed investment decisions.
- Biotech Analysts: Enhance your analysis with tailored models specific to the genetic testing industry.
- Patients and Families: Learn about the benefits of genetic testing and how it can impact health outcomes.
What the Template Contains
- Preloaded NTRA Data: Historical and projected financial data, including revenue, EBIT, and capital expenditures.
- DCF and WACC Models: Professional-grade sheets for calculating intrinsic value and Weighted Average Cost of Capital.
- Editable Inputs: Yellow-highlighted cells for adjusting revenue growth, tax rates, and discount rates.
- Financial Statements: Comprehensive annual and quarterly financials for deeper analysis.
- Key Ratios: Profitability, leverage, and efficiency ratios to evaluate performance.
- Dashboard and Charts: Visual summaries of valuation outcomes and assumptions.
Disclaimer
All information, articles, and product details provided on this website are for general informational and educational purposes only. We do not claim any ownership over, nor do we intend to infringe upon, any trademarks, copyrights, logos, brand names, or other intellectual property mentioned or depicted on this site. Such intellectual property remains the property of its respective owners, and any references here are made solely for identification or informational purposes, without implying any affiliation, endorsement, or partnership.
We make no representations or warranties, express or implied, regarding the accuracy, completeness, or suitability of any content or products presented. Nothing on this website should be construed as legal, tax, investment, financial, medical, or other professional advice. In addition, no part of this site—including articles or product references—constitutes a solicitation, recommendation, endorsement, advertisement, or offer to buy or sell any securities, franchises, or other financial instruments, particularly in jurisdictions where such activity would be unlawful.
All content is of a general nature and may not address the specific circumstances of any individual or entity. It is not a substitute for professional advice or services. Any actions you take based on the information provided here are strictly at your own risk. You accept full responsibility for any decisions or outcomes arising from your use of this website and agree to release us from any liability in connection with your use of, or reliance upon, the content or products found herein.