
|
Nutriband Inc. (NTRB) DCF -Bewertung |
Fully Editable: Tailor To Your Needs In Excel Or Sheets
Professional Design: Trusted, Industry-Standard Templates
Investor-Approved Valuation Models
MAC/PC Compatible, Fully Unlocked
No Expertise Is Needed; Easy To Follow
Nutriband Inc. (NTRB) Bundle
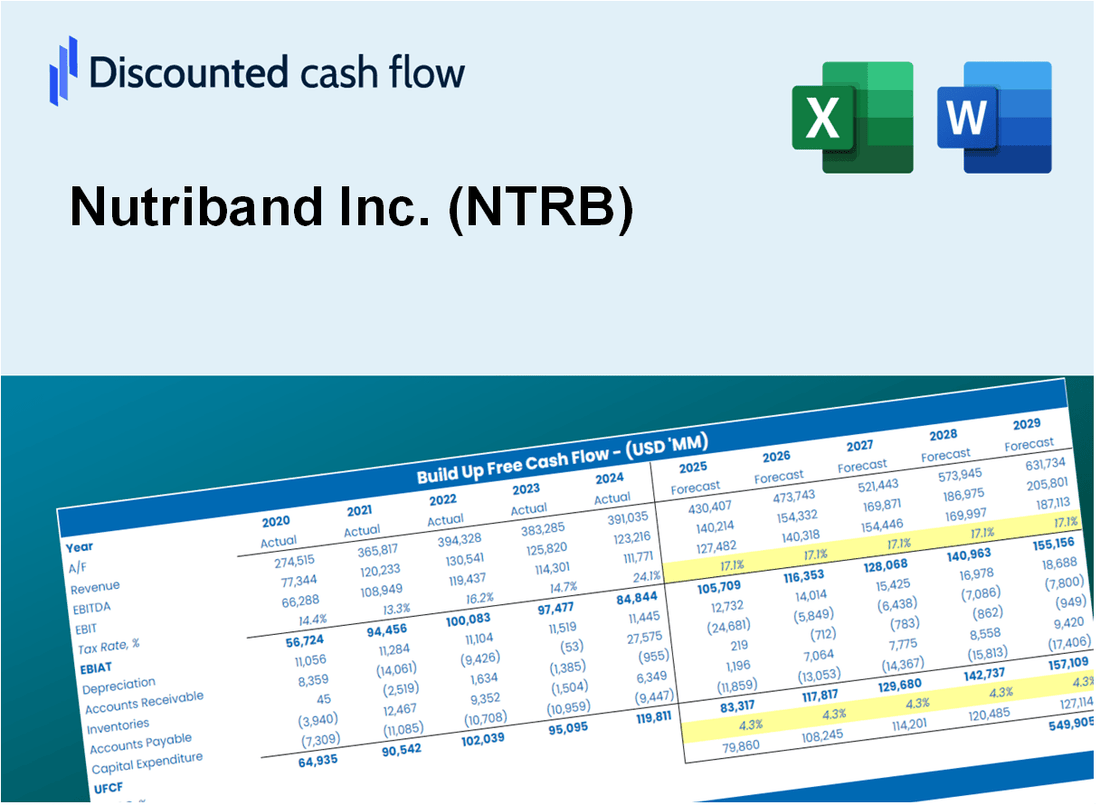
Gewinnen Sie einen Einblick in Ihre Nutriband Inc. -Bewertungsanalyse (NTRB) mit unserem ausgefeilten DCF -Taschenrechner! Diese Excel -Vorlage mit authentischen (NTRB) -Daten (NTRB) -Daten, ermöglicht es Ihnen, Vorhersagen und Annahmen anzupassen und präzise Berechnungen des inneren Werts von Nutriband Inc. zu ermöglichen.
What You Will Get
- Real NTRB Financials: Access to historical and projected data for precise valuation.
- Customizable Inputs: Adjust WACC, tax rates, revenue growth, and capital expenditures as needed.
- Instant Calculations: Intrinsic value and NPV are computed in real-time.
- Scenario Analysis: Evaluate various scenarios to assess Nutriband's future performance.
- User-Friendly Design: Designed for industry experts while remaining easy for newcomers to navigate.
Key Features
- 🔍 Real-Life NTRB Financials: Pre-filled historical and projected data for Nutriband Inc.
- ✏️ Fully Customizable Inputs: Adjust all critical parameters (yellow cells) like WACC, growth %, and tax rates.
- 📊 Professional DCF Valuation: Built-in formulas calculate Nutriband’s intrinsic value using the Discounted Cash Flow method.
- ⚡ Instant Results: Visualize Nutriband’s valuation instantly after making changes.
- Scenario Analysis: Test and compare outcomes for various financial assumptions side-by-side.
How It Works
- Download: Obtain the pre-prepared Excel file containing Nutriband Inc.'s (NTRB) financial metrics.
- Customize: Tailor your projections, including revenue growth, EBITDA %, and WACC to fit your analysis.
- Update Automatically: The intrinsic value and NPV calculations refresh in real-time as you make changes.
- Test Scenarios: Generate various projections and swiftly compare the results.
- Make Decisions: Leverage the valuation insights to inform your investment choices.
Why Choose This Calculator for Nutriband Inc. (NTRB)?
- Designed for Industry Experts: A specialized tool tailored for nutritionists, investors, and health consultants.
- Up-to-Date Data: Nutriband’s current and projected financials are preloaded for precision.
- Flexible Scenario Analysis: Effortlessly test various forecasts and assumptions.
- Comprehensive Outputs: Automatically computes intrinsic value, NPV, and essential metrics.
- User-Friendly: Step-by-step guidance makes the process straightforward.
Who Should Use Nutriband Inc. (NTRB)?
- Healthcare Professionals: Utilize advanced drug delivery systems for improved patient outcomes.
- Pharmaceutical Companies: Analyze innovative solutions to enhance product offerings and market reach.
- Investors: Gain insights into the potential of Nutriband Inc. (NTRB) for informed investment decisions.
- Researchers and Academics: Explore cutting-edge technologies in transdermal delivery for educational purposes.
- Health and Wellness Enthusiasts: Understand how Nutriband Inc. (NTRB) is revolutionizing drug administration methods.
What the Template Contains
- Operating and Balance Sheet Data: Pre-filled Nutriband Inc. (NTRB) historical data and forecasts, including revenue, EBITDA, EBIT, and capital expenditures.
- WACC Calculation: A dedicated sheet for Weighted Average Cost of Capital (WACC), including parameters like Beta, risk-free rate, and share price.
- DCF Valuation (Unlevered and Levered): Editable Discounted Cash Flow models showing intrinsic value with detailed calculations.
- Financial Statements: Pre-loaded financial statements (annual and quarterly) to support analysis.
- Key Ratios: Includes profitability, leverage, and efficiency ratios for Nutriband Inc. (NTRB).
- Dashboard and Charts: Visual summary of valuation outputs and assumptions to analyze results easily.
Disclaimer
All information, articles, and product details provided on this website are for general informational and educational purposes only. We do not claim any ownership over, nor do we intend to infringe upon, any trademarks, copyrights, logos, brand names, or other intellectual property mentioned or depicted on this site. Such intellectual property remains the property of its respective owners, and any references here are made solely for identification or informational purposes, without implying any affiliation, endorsement, or partnership.
We make no representations or warranties, express or implied, regarding the accuracy, completeness, or suitability of any content or products presented. Nothing on this website should be construed as legal, tax, investment, financial, medical, or other professional advice. In addition, no part of this site—including articles or product references—constitutes a solicitation, recommendation, endorsement, advertisement, or offer to buy or sell any securities, franchises, or other financial instruments, particularly in jurisdictions where such activity would be unlawful.
All content is of a general nature and may not address the specific circumstances of any individual or entity. It is not a substitute for professional advice or services. Any actions you take based on the information provided here are strictly at your own risk. You accept full responsibility for any decisions or outcomes arising from your use of this website and agree to release us from any liability in connection with your use of, or reliance upon, the content or products found herein.