
|
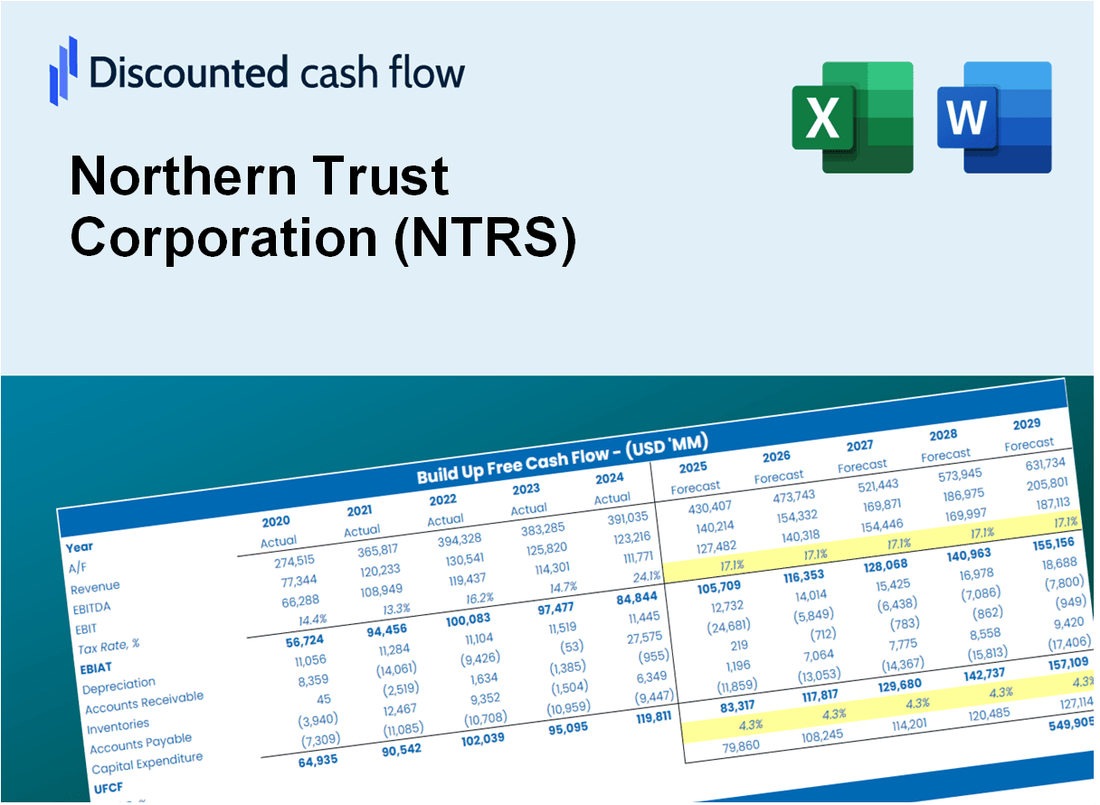
DCF -Bewertung der Northern Trust Corporation (NTRS) |
Fully Editable: Tailor To Your Needs In Excel Or Sheets
Professional Design: Trusted, Industry-Standard Templates
Investor-Approved Valuation Models
MAC/PC Compatible, Fully Unlocked
No Expertise Is Needed; Easy To Follow
Northern Trust Corporation (NTRS) Bundle
Als Investor oder Analyst ist der DCF-Taschenrechner der Northern Trust Corporation (NTRS) Ihre Anlaufstelle für eine genaue Bewertung. Ausgestattet mit echten Daten der Northern Trust Corporation können Sie Prognosen anpassen und die Auswirkungen sofort beobachten.
Discounted Cash Flow (DCF) - (USD MM)
| Year | AY1 2020 |
AY2 2021 |
AY3 2022 |
AY4 2023 |
AY5 2024 |
FY1 2025 |
FY2 2026 |
FY3 2027 |
FY4 2028 |
FY5 2029 |
|---|---|---|---|---|---|---|---|---|---|---|
| Revenue | 6,301.1 | 6,488.3 | 7,751.7 | 12,116.5 | 15,875.6 | 20,232.5 | 25,785.0 | 32,861.4 | 41,879.8 | 53,373.2 |
| Revenue Growth, % | 0 | 2.97 | 19.47 | 56.31 | 31.02 | 27.44 | 27.44 | 27.44 | 27.44 | 27.44 |
| EBITDA | 2,127.9 | 2,525.7 | 2,319.9 | 2,099.4 | 3,376.3 | 5,714.4 | 7,282.7 | 9,281.3 | 11,828.4 | 15,074.6 |
| EBITDA, % | 33.77 | 38.93 | 29.93 | 17.33 | 21.27 | 28.24 | 28.24 | 28.24 | 28.24 | 28.24 |
| Depreciation | 500.3 | 515.6 | 553.6 | 634.6 | 716.8 | 1,326.5 | 1,690.5 | 2,154.4 | 2,745.7 | 3,499.2 |
| Depreciation, % | 7.94 | 7.95 | 7.14 | 5.24 | 4.52 | 6.56 | 6.56 | 6.56 | 6.56 | 6.56 |
| EBIT | 1,627.6 | 2,010.1 | 1,766.3 | 1,464.8 | 2,659.5 | 4,387.9 | 5,592.2 | 7,126.9 | 9,082.7 | 11,575.4 |
| EBIT, % | 25.83 | 30.98 | 22.79 | 12.09 | 16.75 | 21.69 | 21.69 | 21.69 | 21.69 | 21.69 |
| Total Cash | 107,884.7 | 108,285.6 | 74,523.1 | 64,931.2 | 56,541.3 | 20,232.5 | 25,785.0 | 32,861.4 | 41,879.8 | 53,373.2 |
| Total Cash, percent | .0 | .0 | .0 | .0 | .0 | .0 | .0 | .0 | .0 | .0 |
| Account Receivables | 1,171.6 | 1,952.2 | 1,698.3 | 212.6 | 41.1 | 2,937.9 | 3,744.2 | 4,771.7 | 6,081.3 | 7,750.2 |
| Account Receivables, % | 18.59 | 30.09 | 21.91 | 1.75 | 0.25889 | 14.52 | 14.52 | 14.52 | 14.52 | 14.52 |
| Inventories | .0 | .0 | .0 | .0 | .0 | .0 | .0 | .0 | .0 | .0 |
| Inventories, % | 0 | 0 | 0 | 0 | 0 | 0 | 0 | 0 | 0 | 0 |
| Accounts Payable | .0 | .0 | .0 | .0 | .0 | .0 | .0 | .0 | .0 | .0 |
| Accounts Payable, % | 0 | 0 | 0 | 0 | 0 | 0 | 0 | 0 | 0 | 0 |
| Capital Expenditure | -560.4 | -515.1 | -723.5 | -675.8 | -745.5 | -1,474.5 | -1,879.2 | -2,394.9 | -3,052.2 | -3,889.8 |
| Capital Expenditure, % | -8.89 | -7.94 | -9.33 | -5.58 | -4.7 | -7.29 | -7.29 | -7.29 | -7.29 | -7.29 |
| Tax Rate, % | 23.63 | 23.63 | 23.63 | 23.63 | 23.63 | 23.63 | 23.63 | 23.63 | 23.63 | 23.63 |
| EBITAT | 1,209.3 | 1,545.3 | 1,336.0 | 1,107.3 | 2,031.1 | 3,324.1 | 4,236.4 | 5,399.0 | 6,880.7 | 8,769.1 |
| Depreciation | ||||||||||
| Changes in Account Receivables | ||||||||||
| Changes in Inventories | ||||||||||
| Changes in Accounts Payable | ||||||||||
| Capital Expenditure | ||||||||||
| UFCF | -22.4 | 765.2 | 1,420.0 | 2,551.8 | 2,173.9 | 279.3 | 3,241.4 | 4,131.0 | 5,264.7 | 6,709.6 |
| WACC, % | 19.57 | 20.04 | 19.81 | 19.81 | 19.95 | 19.84 | 19.84 | 19.84 | 19.84 | 19.84 |
| PV UFCF | ||||||||||
| SUM PV UFCF | 10,158.6 | |||||||||
| Long Term Growth Rate, % | 2.00 | |||||||||
| Free cash flow (T + 1) | 6,844 | |||||||||
| Terminal Value | 38,372 | |||||||||
| Present Terminal Value | 15,527 | |||||||||
| Enterprise Value | 25,686 | |||||||||
| Net Debt | -29,404 | |||||||||
| Equity Value | 55,089 | |||||||||
| Diluted Shares Outstanding, MM | 202 | |||||||||
| Equity Value Per Share | 272.90 |
What You Will Get
- Real Northern Trust Data: Preloaded financials – from revenue to EBIT – based on actual and projected figures for Northern Trust Corporation (NTRS).
- Full Customization: Adjust all critical parameters (yellow cells) such as WACC, growth %, and tax rates to fit your analysis.
- Instant Valuation Updates: Automatic recalculations to assess the impact of changes on Northern Trust’s fair value.
- Versatile Excel Template: Designed for quick edits, scenario testing, and comprehensive projections.
- Time-Saving and Accurate: Eliminate the need to build models from scratch while ensuring precision and flexibility.
Key Features
- Comprehensive NTRS Data: Pre-loaded with Northern Trust's historical financial performance and future forecasts.
- Customizable Assumptions: Tailor inputs for revenue growth, profit margins, weighted average cost of capital (WACC), tax rates, and capital expenditures.
- Interactive Valuation Framework: Automatically refreshes Net Present Value (NPV) and intrinsic value based on your customized inputs.
- Scenario Analysis: Develop various forecasting scenarios to evaluate different valuation possibilities.
- Intuitive Interface: Designed to be straightforward and accessible for both seasoned professionals and newcomers.
How It Works
- 1. Access the Template: Download and open the Excel file containing Northern Trust Corporation’s (NTRS) preloaded data.
- 2. Modify Assumptions: Adjust key inputs such as growth rates, WACC, and capital expenditures.
- 3. View Instant Results: The DCF model automatically calculates the intrinsic value and NPV.
- 4. Explore Scenarios: Evaluate various forecasts to assess different valuation outcomes.
- 5. Present with Assurance: Deliver professional valuation insights to reinforce your decision-making.
Why Choose This Calculator for Northern Trust Corporation (NTRS)?
- Designed for Experts: A sophisticated tool utilized by financial analysts, investment managers, and corporate strategists.
- Accurate Financial Data: Northern Trust’s historical and projected financial information is preloaded for precision.
- Flexible Scenario Analysis: Effortlessly test various forecasts and assumptions.
- Comprehensive Outputs: Automatically computes intrinsic value, NPV, and essential financial metrics.
- User-Friendly Interface: Detailed instructions provide a seamless experience throughout the process.
Who Should Use This Product?
- Investors: Evaluate Northern Trust Corporation's (NTRS) performance before making investment decisions.
- CFOs and Financial Analysts: Enhance valuation methodologies and validate financial forecasts.
- Startup Founders: Gain insights into how established financial institutions like Northern Trust are valued.
- Consultants: Provide comprehensive valuation assessments for clients in the finance sector.
- Students and Educators: Utilize real-time data to learn and teach financial valuation principles.
What the Template Contains
- Pre-Filled DCF Model: Northern Trust Corporation’s (NTRS) financial data preloaded for immediate use.
- WACC Calculator: Detailed calculations for Weighted Average Cost of Capital.
- Financial Ratios: Evaluate Northern Trust Corporation’s (NTRS) profitability, leverage, and efficiency.
- Editable Inputs: Change assumptions such as growth, margins, and CAPEX to fit your scenarios.
- Financial Statements: Annual and quarterly reports to support detailed analysis.
- Interactive Dashboard: Easily visualize key valuation metrics and results.
Disclaimer
All information, articles, and product details provided on this website are for general informational and educational purposes only. We do not claim any ownership over, nor do we intend to infringe upon, any trademarks, copyrights, logos, brand names, or other intellectual property mentioned or depicted on this site. Such intellectual property remains the property of its respective owners, and any references here are made solely for identification or informational purposes, without implying any affiliation, endorsement, or partnership.
We make no representations or warranties, express or implied, regarding the accuracy, completeness, or suitability of any content or products presented. Nothing on this website should be construed as legal, tax, investment, financial, medical, or other professional advice. In addition, no part of this site—including articles or product references—constitutes a solicitation, recommendation, endorsement, advertisement, or offer to buy or sell any securities, franchises, or other financial instruments, particularly in jurisdictions where such activity would be unlawful.
All content is of a general nature and may not address the specific circumstances of any individual or entity. It is not a substitute for professional advice or services. Any actions you take based on the information provided here are strictly at your own risk. You accept full responsibility for any decisions or outcomes arising from your use of this website and agree to release us from any liability in connection with your use of, or reliance upon, the content or products found herein.