
|
NetSol Technologies, Inc. (NTWK) DCF -Bewertung |
Fully Editable: Tailor To Your Needs In Excel Or Sheets
Professional Design: Trusted, Industry-Standard Templates
Investor-Approved Valuation Models
MAC/PC Compatible, Fully Unlocked
No Expertise Is Needed; Easy To Follow
NetSol Technologies, Inc. (NTWK) Bundle
Vereinfachen Sie die Bewertung von NetSol Technologies, Inc. (NTWK) mit diesem anpassbaren DCF -Taschenrechner! Mit Real NetSol Technologies, Inc. (NTWK) Finanzdaten und einstellbaren Prognoseeingängen können Sie Szenarien testen und NetSol Technologies, Inc. (NTWK) in wenigen Minuten aufdecken.
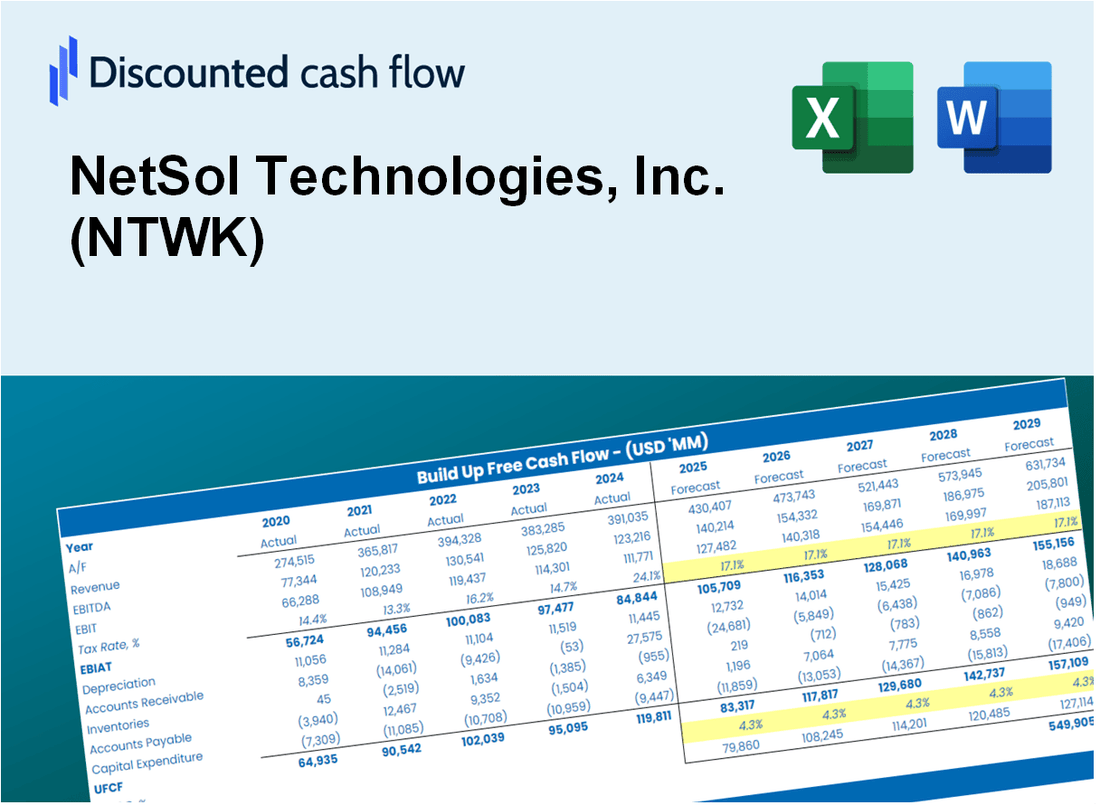
Discounted Cash Flow (DCF) - (USD MM)
| Year | AY1 2021 |
AY2 2022 |
AY3 2023 |
AY4 2024 |
AY5 2025 |
FY1 2026 |
FY2 2027 |
FY3 2028 |
FY4 2029 |
FY5 2030 |
|---|---|---|---|---|---|---|---|---|---|---|
| Revenue | 54.9 | 57.2 | 52.4 | 61.4 | 66.1 | 69.5 | 73.1 | 76.8 | 80.8 | 84.9 |
| Revenue Growth, % | 0 | 4.24 | -8.48 | 17.18 | 7.65 | 5.15 | 5.15 | 5.15 | 5.15 | 5.15 |
| EBITDA | 7.6 | 6.3 | .8 | 6.1 | 5.0 | 6.1 | 6.4 | 6.7 | 7.1 | 7.4 |
| EBITDA, % | 13.91 | 10.96 | 1.51 | 9.92 | 7.51 | 8.76 | 8.76 | 8.76 | 8.76 | 8.76 |
| Depreciation | 4.0 | 3.8 | 3.2 | 1.7 | 1.5 | 3.5 | 3.7 | 3.9 | 4.1 | 4.3 |
| Depreciation, % | 7.2 | 6.66 | 6.19 | 2.8 | 2.21 | 5.02 | 5.02 | 5.02 | 5.02 | 5.02 |
| EBIT | 3.7 | 2.5 | -2.5 | 4.4 | 3.5 | 2.6 | 2.7 | 2.9 | 3.0 | 3.2 |
| EBIT, % | 6.71 | 4.3 | -4.68 | 7.11 | 5.3 | 3.75 | 3.75 | 3.75 | 3.75 | 3.75 |
| Total Cash | 33.7 | 24.0 | 15.5 | 19.1 | 17.4 | 26.4 | 27.8 | 29.2 | 30.7 | 32.3 |
| Total Cash, percent | .0 | .0 | .0 | .0 | .0 | .0 | .0 | .0 | .0 | .0 |
| Account Receivables | 19.0 | 23.2 | 24.1 | 25.7 | 25.8 | 28.1 | 29.5 | 31.0 | 32.6 | 34.3 |
| Account Receivables, % | 34.61 | 40.6 | 45.98 | 41.92 | 38.98 | 40.42 | 40.42 | 40.42 | 40.42 | 40.42 |
| Inventories | .0 | 1.9 | 1.7 | -.6 | .0 | .8 | .8 | .9 | .9 | 1.0 |
| Inventories, % | 0 | 3.35 | 3.22 | -0.91093 | 0 | 1.13 | 1.13 | 1.13 | 1.13 | 1.13 |
| Accounts Payable | 1.1 | 1.2 | 1.1 | 1.4 | 8.0 | 2.9 | 3.0 | 3.2 | 3.3 | 3.5 |
| Accounts Payable, % | 1.94 | 2.05 | 2.13 | 2.32 | 12.12 | 4.11 | 4.11 | 4.11 | 4.11 | 4.11 |
| Capital Expenditure | -2.6 | -2.6 | -1.6 | -.5 | -1.4 | -2.1 | -2.2 | -2.3 | -2.5 | -2.6 |
| Capital Expenditure, % | -4.65 | -4.56 | -3.13 | -0.83951 | -2.09 | -3.05 | -3.05 | -3.05 | -3.05 | -3.05 |
| Tax Rate, % | 51.66 | 51.66 | 51.66 | 51.66 | 51.66 | 51.66 | 51.66 | 51.66 | 51.66 | 51.66 |
| EBITAT | 2.0 | -1.0 | -4.0 | .9 | 1.7 | 1.2 | 1.2 | 1.3 | 1.4 | 1.4 |
| Depreciation | ||||||||||
| Changes in Account Receivables | ||||||||||
| Changes in Inventories | ||||||||||
| Changes in Accounts Payable | ||||||||||
| Capital Expenditure | ||||||||||
| UFCF | -14.5 | -5.8 | -3.1 | 3.1 | 7.8 | -5.7 | 1.3 | 1.4 | 1.5 | 1.5 |
| WACC, % | 7.2 | 6.12 | 8.12 | 6.54 | 7.09 | 7.02 | 7.02 | 7.02 | 7.02 | 7.02 |
| PV UFCF | ||||||||||
| SUM PV UFCF | -.9 | |||||||||
| Long Term Growth Rate, % | 2.00 | |||||||||
| Free cash flow (T + 1) | 2 | |||||||||
| Terminal Value | 31 | |||||||||
| Present Terminal Value | 22 | |||||||||
| Enterprise Value | 21 | |||||||||
| Net Debt | -8 | |||||||||
| Equity Value | 30 | |||||||||
| Diluted Shares Outstanding, MM | 12 | |||||||||
| Equity Value Per Share | 2.55 |
What You Will Get
- Real NTWK Financials: Comprehensive historical and projected data for precise valuation.
- Customizable Inputs: Adjust WACC, tax rates, revenue growth, and capital expenditures as needed.
- Dynamic Calculations: Intrinsic value and NPV are computed in real-time.
- Scenario Analysis: Explore various scenarios to assess NetSol's future performance.
- User-Friendly Design: Designed for professionals while remaining approachable for newcomers.
Key Features
- Comprehensive DCF Calculator: Features detailed unlevered and levered DCF valuation models tailored for NetSol Technologies, Inc. (NTWK).
- WACC Calculator: Comes with a pre-built Weighted Average Cost of Capital sheet that allows for customizable inputs specific to NTWK.
- Modifiable Forecast Assumptions: Adjust growth rates, capital expenditures, and discount rates to fit your analysis of NetSol Technologies, Inc. (NTWK).
- Integrated Financial Ratios: Evaluate profitability, leverage, and efficiency ratios specifically for NetSol Technologies, Inc. (NTWK).
- Interactive Dashboard and Charts: Visual representations summarize essential valuation metrics for straightforward analysis of NetSol Technologies, Inc. (NTWK).
How It Works
- Download the Template: Gain immediate access to the Excel-based NTWK DCF Calculator.
- Input Your Assumptions: Modify the yellow-highlighted cells for growth rates, WACC, margins, and additional parameters.
- Instant Calculations: The model will automatically refresh NetSol Technologies' intrinsic value.
- Test Scenarios: Experiment with various assumptions to assess potential valuation impacts.
- Analyze and Decide: Utilize the outcomes to inform your investment or financial strategy.
Why Choose This Calculator?
- Comprehensive Tool: Integrates DCF, WACC, and financial ratio analyses specifically for NetSol Technologies, Inc. (NTWK).
- Customizable Inputs: Modify yellow-highlighted cells to explore different financial scenarios.
- Detailed Insights: Automatically computes NetSol's intrinsic value and Net Present Value.
- Preloaded Data: Historical and projected data provide reliable starting points for analysis.
- Professional Quality: Perfect for financial analysts, investors, and business consultants focusing on NTWK.
Who Should Use This Product?
- Tech Entrepreneurs: Discover innovative strategies and apply them using real-world data.
- Researchers: Integrate advanced models into academic studies or publications.
- Investors: Evaluate your investment hypotheses and analyze valuation metrics for NetSol Technologies, Inc. (NTWK).
- Market Analysts: Enhance your analytical processes with a customizable financial modeling toolkit.
- Business Strategists: Learn how technology firms like NetSol Technologies, Inc. (NTWK) are assessed in the market.
What the Template Contains
- Comprehensive DCF Model: Editable template featuring detailed valuation calculations tailored for NetSol Technologies, Inc. (NTWK).
- Real-World Data: Historical and projected financials for NetSol Technologies preloaded for in-depth analysis.
- Customizable Parameters: Modify WACC, growth rates, and tax assumptions to explore various scenarios.
- Financial Statements: Complete annual and quarterly breakdowns providing deeper insights into the company's performance.
- Key Ratios: Integrated analysis for assessing profitability, efficiency, and financial leverage.
- Dashboard with Visual Outputs: Interactive charts and tables delivering clear, actionable results for decision-making.
Disclaimer
All information, articles, and product details provided on this website are for general informational and educational purposes only. We do not claim any ownership over, nor do we intend to infringe upon, any trademarks, copyrights, logos, brand names, or other intellectual property mentioned or depicted on this site. Such intellectual property remains the property of its respective owners, and any references here are made solely for identification or informational purposes, without implying any affiliation, endorsement, or partnership.
We make no representations or warranties, express or implied, regarding the accuracy, completeness, or suitability of any content or products presented. Nothing on this website should be construed as legal, tax, investment, financial, medical, or other professional advice. In addition, no part of this site—including articles or product references—constitutes a solicitation, recommendation, endorsement, advertisement, or offer to buy or sell any securities, franchises, or other financial instruments, particularly in jurisdictions where such activity would be unlawful.
All content is of a general nature and may not address the specific circumstances of any individual or entity. It is not a substitute for professional advice or services. Any actions you take based on the information provided here are strictly at your own risk. You accept full responsibility for any decisions or outcomes arising from your use of this website and agree to release us from any liability in connection with your use of, or reliance upon, the content or products found herein.