
|
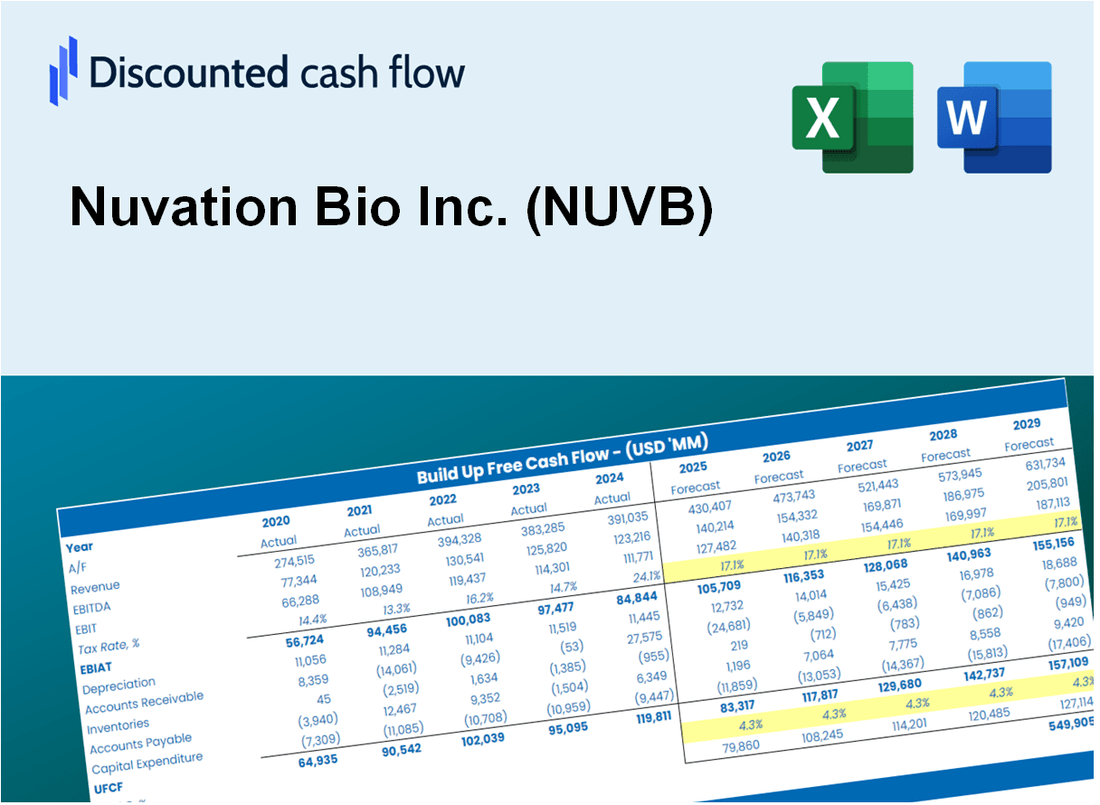
Nuvation Bio Inc. (NUVB) DCF -Bewertung |
Fully Editable: Tailor To Your Needs In Excel Or Sheets
Professional Design: Trusted, Industry-Standard Templates
Investor-Approved Valuation Models
MAC/PC Compatible, Fully Unlocked
No Expertise Is Needed; Easy To Follow
Nuvation Bio Inc. (NUVB) Bundle
Entdecken Sie die finanziellen Aussichten von Nuvation Bio Inc. (NUVB) mit unserem benutzerfreundlichen DCF-Taschenrechner! Geben Sie Ihre Annahmen in Bezug auf Wachstum, Margen und Ausgaben ein, um den intrinsischen Wert der Nuvation Bio Inc. (NUVB) zu bestimmen und Ihre Anlageentscheidungen zu informieren.
What You Will Get
- Real Nuvation Bio Data: Preloaded financials – from revenue to EBIT – based on actual and projected figures.
- Full Customization: Adjust all critical parameters (yellow cells) like WACC, growth %, and tax rates.
- Instant Valuation Updates: Automatic recalculations to analyze the impact of changes on Nuvation Bio’s fair value.
- Versatile Excel Template: Tailored for quick edits, scenario testing, and detailed projections.
- Time-Saving and Accurate: Skip building models from scratch while maintaining precision and flexibility.
Key Features
- Comprehensive Data: Nuvation Bio Inc.'s (NUVB) historical financial reports and pre-filled projections.
- Customizable Parameters: Modify WACC, tax rates, revenue growth, and EBITDA margins as needed.
- Real-Time Insights: Observe the recalculation of Nuvation Bio Inc.'s (NUVB) intrinsic value instantly.
- Intuitive Visualizations: Dashboard graphs showcase valuation outcomes and essential metrics.
- Designed for Precision: A reliable tool tailored for analysts, investors, and financial professionals.
How It Works
- Download the Template: Gain immediate access to the Excel-based Nuvation Bio Inc. (NUVB) DCF Calculator.
- Input Your Assumptions: Modify the yellow-highlighted cells for growth rates, WACC, margins, and other key metrics.
- Instant Calculations: The model automatically recalculates Nuvation Bio Inc.’s intrinsic value.
- Test Scenarios: Experiment with various assumptions to assess potential valuation shifts.
- Analyze and Decide: Utilize the outcomes to inform your investment or financial decisions.
Why Choose Nuvation Bio Inc. (NUVB)?
- Innovative Solutions: Leverage cutting-edge technology for advanced biopharmaceutical development.
- Expert Team: Collaborate with industry leaders and experienced professionals in biotech.
- Robust Pipeline: Benefit from a diverse range of therapeutic candidates targeting unmet medical needs.
- Commitment to Quality: Adhere to the highest standards in research and development for reliable results.
- Growth Potential: Invest in a company poised for significant advancements in the biopharmaceutical landscape.
Who Should Use This Product?
- Individual Investors: Make informed decisions about buying or selling Nuvation Bio Inc. (NUVB) stock.
- Financial Analysts: Streamline valuation processes with ready-to-use financial models specific to Nuvation Bio Inc. (NUVB).
- Consultants: Deliver professional valuation insights on Nuvation Bio Inc. (NUVB) to clients quickly and accurately.
- Business Owners: Understand how biotech companies like Nuvation Bio Inc. (NUVB) are valued to guide your own strategy.
- Finance Students: Learn valuation techniques using real-world data and scenarios, including Nuvation Bio Inc. (NUVB).
What the Template Contains
- Pre-Filled DCF Model: Nuvation Bio Inc.'s (NUVB) financial data preloaded for immediate use.
- WACC Calculator: Detailed calculations for Weighted Average Cost of Capital.
- Financial Ratios: Evaluate Nuvation Bio Inc.'s (NUVB) profitability, leverage, and efficiency.
- Editable Inputs: Change assumptions such as growth, margins, and CAPEX to fit your scenarios.
- Financial Statements: Annual and quarterly reports to support detailed analysis.
- Interactive Dashboard: Easily visualize key valuation metrics and results.
Disclaimer
All information, articles, and product details provided on this website are for general informational and educational purposes only. We do not claim any ownership over, nor do we intend to infringe upon, any trademarks, copyrights, logos, brand names, or other intellectual property mentioned or depicted on this site. Such intellectual property remains the property of its respective owners, and any references here are made solely for identification or informational purposes, without implying any affiliation, endorsement, or partnership.
We make no representations or warranties, express or implied, regarding the accuracy, completeness, or suitability of any content or products presented. Nothing on this website should be construed as legal, tax, investment, financial, medical, or other professional advice. In addition, no part of this site—including articles or product references—constitutes a solicitation, recommendation, endorsement, advertisement, or offer to buy or sell any securities, franchises, or other financial instruments, particularly in jurisdictions where such activity would be unlawful.
All content is of a general nature and may not address the specific circumstances of any individual or entity. It is not a substitute for professional advice or services. Any actions you take based on the information provided here are strictly at your own risk. You accept full responsibility for any decisions or outcomes arising from your use of this website and agree to release us from any liability in connection with your use of, or reliance upon, the content or products found herein.