|
NVE Corporation (NVEC) DCF -Bewertung |
Fully Editable: Tailor To Your Needs In Excel Or Sheets
Professional Design: Trusted, Industry-Standard Templates
Investor-Approved Valuation Models
MAC/PC Compatible, Fully Unlocked
No Expertise Is Needed; Easy To Follow
NVE Corporation (NVEC) Bundle
Verbessern Sie Ihre Anlagestrategien mit dem DCF -Taschenrechner der NVE Corporation (NVEC)! Verwenden Sie authentische NVE -Finanzdaten, passen Sie Wachstumsprojektionen und -kosten an und beachten Sie sofort, wie sich diese Modifikationen auf den inneren Wert der NVE Corporation (NVEC) auswirken.
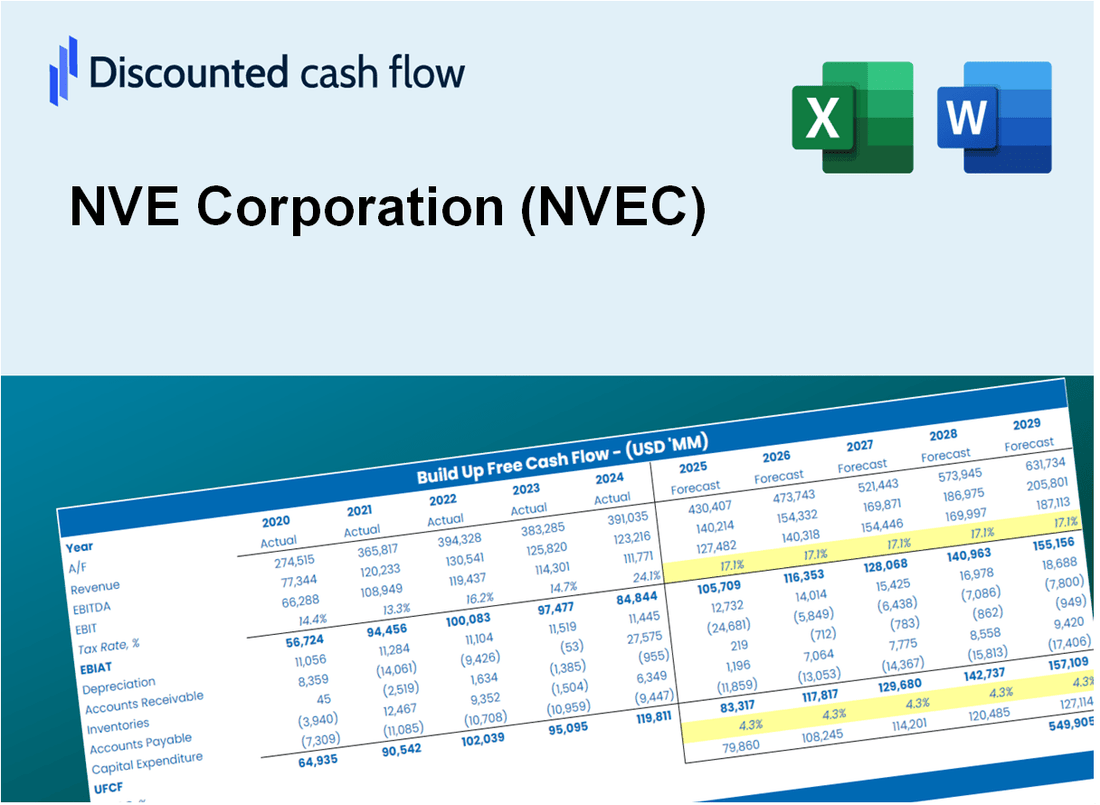
Discounted Cash Flow (DCF) - (USD MM)
| Year | AY1 2021 |
AY2 2022 |
AY3 2023 |
AY4 2024 |
AY5 2025 |
FY1 2026 |
FY2 2027 |
FY3 2028 |
FY4 2029 |
FY5 2030 |
|---|---|---|---|---|---|---|---|---|---|---|
| Revenue | 21.4 | 27.0 | 38.3 | 29.8 | 25.9 | 28.0 | 30.3 | 32.8 | 35.5 | 38.4 |
| Revenue Growth, % | 0 | 26.31 | 41.75 | -22.09 | -13.18 | 8.2 | 8.2 | 8.2 | 8.2 | 8.2 |
| EBITDA | 13.3 | 16.8 | 25.8 | 18.8 | 16.3 | 17.8 | 19.3 | 20.8 | 22.6 | 24.4 |
| EBITDA, % | 62.18 | 62.08 | 67.55 | 63.17 | 63.07 | 63.61 | 63.61 | 63.61 | 63.61 | 63.61 |
| Depreciation | .5 | .4 | .2 | .3 | .3 | .4 | .4 | .5 | .5 | .5 |
| Depreciation, % | 2.54 | 1.57 | 0.5143 | 1.03 | 1.25 | 1.38 | 1.38 | 1.38 | 1.38 | 1.38 |
| EBIT | 12.7 | 16.3 | 25.6 | 18.5 | 16.0 | 17.4 | 18.8 | 20.4 | 22.1 | 23.9 |
| EBIT, % | 59.64 | 60.51 | 67.04 | 62.14 | 61.81 | 62.23 | 62.23 | 62.23 | 62.23 | 62.23 |
| Total Cash | 18.1 | 31.3 | 17.2 | 22.2 | 21.7 | 21.7 | 23.5 | 25.4 | 27.5 | 29.8 |
| Total Cash, percent | .0 | .0 | .0 | .0 | .0 | .0 | .0 | .0 | .0 | .0 |
| Account Receivables | 2.0 | 4.7 | 6.5 | 3.1 | 3.6 | 3.8 | 4.1 | 4.5 | 4.8 | 5.2 |
| Account Receivables, % | 9.19 | 17.43 | 17.05 | 10.55 | 13.87 | 13.62 | 13.62 | 13.62 | 13.62 | 13.62 |
| Inventories | 3.9 | 5.1 | 6.4 | 7.2 | 7.4 | 6.0 | 6.5 | 7.0 | 7.6 | 8.2 |
| Inventories, % | 18.26 | 18.86 | 16.77 | 24.02 | 28.79 | 21.34 | 21.34 | 21.34 | 21.34 | 21.34 |
| Accounts Payable | .3 | .9 | .3 | .1 | .2 | .4 | .4 | .5 | .5 | .5 |
| Accounts Payable, % | 1.58 | 3.5 | 0.73643 | 0.42663 | 0.82973 | 1.41 | 1.41 | 1.41 | 1.41 | 1.41 |
| Capital Expenditure | -.1 | -.5 | -.9 | .0 | -1.3 | -.5 | -.6 | -.6 | -.7 | -.7 |
| Capital Expenditure, % | -0.29358 | -1.8 | -2.45 | -0.05613642 | -4.86 | -1.89 | -1.89 | -1.89 | -1.89 | -1.89 |
| Tax Rate, % | 16.49 | 16.49 | 16.49 | 16.49 | 16.49 | 16.49 | 16.49 | 16.49 | 16.49 | 16.49 |
| EBITAT | 10.5 | 13.5 | 21.5 | 15.5 | 13.4 | 14.5 | 15.7 | 17.0 | 18.4 | 19.9 |
| Depreciation | ||||||||||
| Changes in Account Receivables | ||||||||||
| Changes in Inventories | ||||||||||
| Changes in Accounts Payable | ||||||||||
| Capital Expenditure | ||||||||||
| UFCF | 5.4 | 10.2 | 16.9 | 18.3 | 11.8 | 15.8 | 14.8 | 16.0 | 17.3 | 18.7 |
| WACC, % | 9.3 | 9.3 | 9.3 | 9.3 | 9.3 | 9.3 | 9.3 | 9.3 | 9.3 | 9.3 |
| PV UFCF | ||||||||||
| SUM PV UFCF | 63.1 | |||||||||
| Long Term Growth Rate, % | 0.50 | |||||||||
| Free cash flow (T + 1) | 19 | |||||||||
| Terminal Value | 213 | |||||||||
| Present Terminal Value | 137 | |||||||||
| Enterprise Value | 200 | |||||||||
| Net Debt | -7 | |||||||||
| Equity Value | 207 | |||||||||
| Diluted Shares Outstanding, MM | 5 | |||||||||
| Equity Value Per Share | 42.79 |
What You Will Get
- Real NVE Corporation Data: Preloaded financials – from revenue to EBIT – based on actual and projected figures.
- Full Customization: Adjust all critical parameters (yellow cells) like WACC, growth %, and tax rates.
- Instant Valuation Updates: Automatic recalculations to analyze the impact of changes on NVE Corporation’s fair value.
- Versatile Excel Template: Tailored for quick edits, scenario testing, and detailed projections.
- Time-Saving and Accurate: Skip building models from scratch while maintaining precision and flexibility.
Key Features
- Comprehensive DCF Calculator: Features detailed unlevered and levered DCF valuation models tailored for NVE Corporation (NVEC).
- WACC Calculator: Pre-configured Weighted Average Cost of Capital sheet with adjustable inputs specific to NVE Corporation (NVEC).
- Customizable Forecast Assumptions: Update growth rates, capital expenditures, and discount rates as per NVE Corporation (NVEC) requirements.
- Integrated Financial Ratios: Evaluate profitability, leverage, and efficiency ratios pertinent to NVE Corporation (NVEC).
- Interactive Dashboard and Charts: Visual representations that summarize essential valuation metrics for straightforward analysis of NVE Corporation (NVEC).
How It Works
- 1. Access the Template: Download and open the Excel file featuring NVE Corporation's (NVEC) preloaded data.
- 2. Adjust Key Inputs: Modify essential parameters such as growth rates, WACC, and capital expenditures.
- 3. View Instant Results: The DCF model automatically computes intrinsic value and NPV in real-time.
- 4. Explore Scenarios: Evaluate various forecasts to examine different valuation possibilities.
- 5. Present with Assurance: Deliver professional valuation insights to enhance your decision-making process.
Why Choose NVE Corporation (NVEC)?
- Innovative Technology: Leading the way in spintronic devices and solutions.
- Proven Performance: A track record of delivering high-quality products and services.
- Customer-Centric Approach: Tailored solutions to meet the unique needs of each client.
- Experienced Team: Backed by experts in the field, ensuring top-notch support.
- Commitment to Sustainability: Focused on environmentally friendly practices and products.
Who Should Use This Product?
- Professional Investors: Develop comprehensive and accurate valuation models for portfolio assessments of NVE Corporation (NVEC).
- Corporate Finance Teams: Evaluate valuation scenarios to inform strategic decisions within the organization.
- Consultants and Advisors: Deliver precise valuation insights for clients interested in NVE Corporation (NVEC) stock.
- Students and Educators: Utilize real-world data to enhance learning and practice in financial modeling.
- Tech Enthusiasts: Gain insights into how companies like NVE Corporation (NVEC) are valued in the technology sector.
What the NVE Corporation (NVEC) Template Contains
- Comprehensive DCF Model: Editable template featuring detailed valuation calculations tailored for NVE Corporation.
- Real-World Data: NVE Corporation’s historical and projected financials preloaded for thorough analysis.
- Customizable Parameters: Modify WACC, growth rates, and tax assumptions to explore various scenarios.
- Financial Statements: Complete annual and quarterly breakdowns for enhanced insights.
- Key Ratios: Integrated analysis for profitability, efficiency, and leverage metrics.
- Dashboard with Visual Outputs: Charts and tables providing clear, actionable results specific to NVE Corporation.
Disclaimer
All information, articles, and product details provided on this website are for general informational and educational purposes only. We do not claim any ownership over, nor do we intend to infringe upon, any trademarks, copyrights, logos, brand names, or other intellectual property mentioned or depicted on this site. Such intellectual property remains the property of its respective owners, and any references here are made solely for identification or informational purposes, without implying any affiliation, endorsement, or partnership.
We make no representations or warranties, express or implied, regarding the accuracy, completeness, or suitability of any content or products presented. Nothing on this website should be construed as legal, tax, investment, financial, medical, or other professional advice. In addition, no part of this site—including articles or product references—constitutes a solicitation, recommendation, endorsement, advertisement, or offer to buy or sell any securities, franchises, or other financial instruments, particularly in jurisdictions where such activity would be unlawful.
All content is of a general nature and may not address the specific circumstances of any individual or entity. It is not a substitute for professional advice or services. Any actions you take based on the information provided here are strictly at your own risk. You accept full responsibility for any decisions or outcomes arising from your use of this website and agree to release us from any liability in connection with your use of, or reliance upon, the content or products found herein.