
|
Natwest Group Plc (NWG.L) DCF -Bewertung |
Fully Editable: Tailor To Your Needs In Excel Or Sheets
Professional Design: Trusted, Industry-Standard Templates
Investor-Approved Valuation Models
MAC/PC Compatible, Fully Unlocked
No Expertise Is Needed; Easy To Follow
NatWest Group plc (NWG.L) Bundle
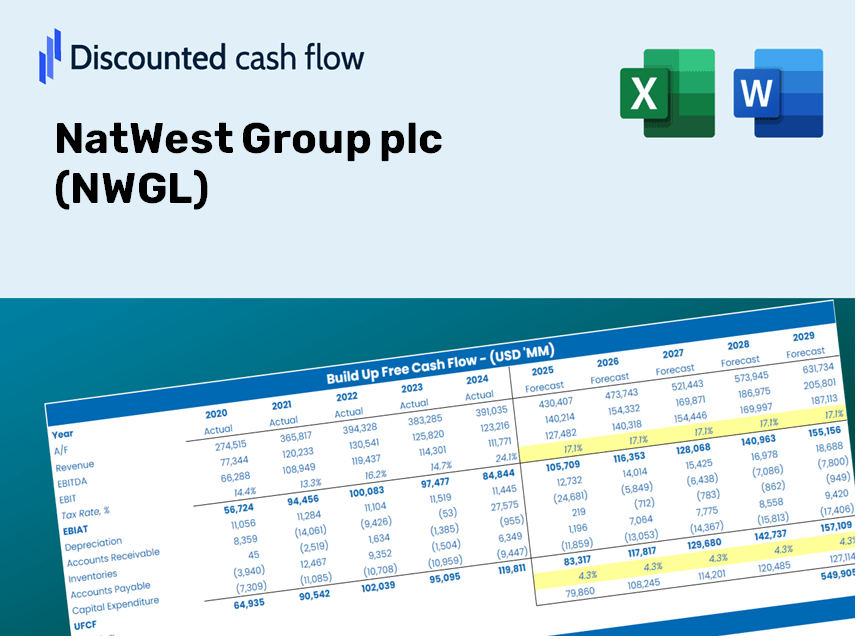
Gewinnen Sie einen Einblick in Ihre NATWEST Group PLC (NWGL) -Wundierungsanalyse mit unserem ausgeklügelten DCF -Taschenrechner! Diese Excel -Vorlage mit realen (NWGL-) Daten ermöglicht es Ihnen, Prognosen und Annahmen anzupassen, um den inneren Wert von NatWest Group PLC genau zu bestimmen.
Discounted Cash Flow (DCF) - (USD MM)
| Year | AY1 2020 |
AY2 2021 |
AY3 2022 |
AY4 2023 |
AY5 2024 |
FY1 2025 |
FY2 2026 |
FY3 2027 |
FY4 2028 |
FY5 2029 |
|---|---|---|---|---|---|---|---|---|---|---|
| Revenue | 7,687.0 | 11,747.0 | 12,980.0 | 14,171.0 | 14,344.0 | 16,987.2 | 20,117.5 | 23,824.6 | 28,214.8 | 33,414.1 |
| Revenue Growth, % | 0 | 52.82 | 10.5 | 9.18 | 1.22 | 18.43 | 18.43 | 18.43 | 18.43 | 18.43 |
| EBITDA | 677.0 | 4,767.0 | 5,552.0 | 6,563.0 | 7,253.0 | 6,422.5 | 7,606.0 | 9,007.5 | 10,667.4 | 12,633.1 |
| EBITDA, % | 8.81 | 40.58 | 42.77 | 46.31 | 50.56 | 37.81 | 37.81 | 37.81 | 37.81 | 37.81 |
| Depreciation | .0 | 923.0 | .0 | .0 | 1,058.0 | 517.5 | 612.9 | 725.9 | 859.6 | 1,018.0 |
| Depreciation, % | 0 | 7.86 | 0 | 0 | 7.38 | 3.05 | 3.05 | 3.05 | 3.05 | 3.05 |
| EBIT | 677.0 | 3,844.0 | 5,552.0 | 6,563.0 | 6,195.0 | 5,904.9 | 6,993.1 | 8,281.7 | 9,807.8 | 11,615.1 |
| EBIT, % | 8.81 | 32.72 | 42.77 | 46.31 | 43.19 | 34.76 | 34.76 | 34.76 | 34.76 | 34.76 |
| Total Cash | 124,489.0 | 177,757.0 | 145,061.0 | 104,517.0 | 182,459.0 | 16,987.2 | 20,117.5 | 23,824.6 | 28,214.8 | 33,414.1 |
| Total Cash, percent | .0 | .0 | .0 | .0 | .0 | .0 | .0 | .0 | .0 | .0 |
| Account Receivables | 216.0 | 248.0 | 327.0 | 292.0 | .0 | 322.8 | 382.3 | 452.7 | 536.1 | 634.9 |
| Account Receivables, % | 2.81 | 2.11 | 2.52 | 2.06 | 0 | 1.9 | 1.9 | 1.9 | 1.9 | 1.9 |
| Inventories | .0 | -355,189.0 | -300,427.0 | -105,159.0 | .0 | -10,192.3 | -12,070.5 | -14,294.8 | -16,928.9 | -20,048.4 |
| Inventories, % | 0 | -3023.66 | -2314.54 | -742.07 | 0 | -60 | -60 | -60 | -60 | -60 |
| Accounts Payable | .0 | .0 | .0 | .0 | .0 | .0 | .0 | .0 | .0 | .0 |
| Accounts Payable, % | 0 | 0 | 0 | 0 | 0 | 0 | 0 | 0 | 0 | 0 |
| Capital Expenditure | -376.0 | -901.0 | -639.0 | -1,555.0 | -1,078.0 | -1,222.2 | -1,447.4 | -1,714.1 | -2,029.9 | -2,404.0 |
| Capital Expenditure, % | -4.89 | -7.67 | -4.92 | -10.97 | -7.52 | -7.19 | -7.19 | -7.19 | -7.19 | -7.19 |
| Tax Rate, % | 22.49 | 22.49 | 22.49 | 22.49 | 22.49 | 22.49 | 22.49 | 22.49 | 22.49 | 22.49 |
| EBITAT | 890.0 | 3,268.0 | 3,882.7 | 4,924.9 | 4,802.0 | 4,812.6 | 5,699.4 | 6,749.6 | 7,993.4 | 9,466.4 |
| Depreciation | ||||||||||
| Changes in Account Receivables | ||||||||||
| Changes in Inventories | ||||||||||
| Changes in Accounts Payable | ||||||||||
| Capital Expenditure | ||||||||||
| UFCF | 298.0 | 358,447.0 | -51,597.3 | -191,863.1 | -100,085.0 | 13,977.5 | 6,683.6 | 7,915.2 | 9,373.8 | 11,101.2 |
| WACC, % | 15.44 | 13.66 | 11.86 | 12.47 | 12.77 | 13.24 | 13.24 | 13.24 | 13.24 | 13.24 |
| PV UFCF | ||||||||||
| SUM PV UFCF | 34,668.3 | |||||||||
| Long Term Growth Rate, % | 2.00 | |||||||||
| Free cash flow (T + 1) | 11,323 | |||||||||
| Terminal Value | 100,739 | |||||||||
| Present Terminal Value | 54,100 | |||||||||
| Enterprise Value | 88,768 | |||||||||
| Net Debt | -27,131 | |||||||||
| Equity Value | 115,899 | |||||||||
| Diluted Shares Outstanding, MM | 8,516 | |||||||||
| Equity Value Per Share | 1,360.95 |
Benefits You Will Receive
- Authentic NatWest Data: Comprehensive financials – including revenue and EBIT – derived from actual and forecasted figures.
- Complete Customization: Modify all essential parameters (yellow cells) such as WACC, growth percentages, and tax rates.
- Immediate Valuation Adjustments: Automatic recalculations to evaluate the effects of changes on NatWest's fair value.
- Flexible Excel Template: Designed for quick modifications, scenario analysis, and in-depth projections.
- Efficient and Precise: Avoid the hassle of constructing models from scratch while ensuring accuracy and adaptability.
Core Capabilities
- Accurate NatWest Financials: Gain access to precise pre-loaded historical data and future forecasts.
- Adjustable Forecast Parameters: Modify highlighted fields such as WACC, growth rates, and profit margins.
- Real-Time Calculations: Automatic updates for DCF, Net Present Value (NPV), and cash flow evaluations.
- Intuitive Visualization Dashboard: Clear charts and summaries to enhance understanding of your valuation outcomes.
- Designed for All Skill Levels: A user-friendly and straightforward layout suitable for investors, CFOs, and consultants alike.
How It Operates
- 1. Access the Template: Download and open the Excel file that contains NatWest Group plc’s (NWGL) preloaded data.
- 2. Adjust Assumptions: Modify essential inputs such as growth rates, WACC, and capital expenditures.
- 3. See Results Instantly: The DCF model automatically computes the intrinsic value and NPV.
- 4. Evaluate Scenarios: Analyze various forecasts to explore different valuation possibilities.
- 5. Present with Assurance: Deliver professional valuation insights to guide your strategic decisions.
Why Opt for This Calculator for NatWest Group plc (NWGL)?
- Reliable Data: Authentic NatWest financials guarantee trustworthy valuation outcomes.
- Flexible: Tailor essential metrics such as growth rates, WACC, and tax rates to suit your forecasts.
- Efficiency: Pre-configured calculations help you avoid starting from ground zero.
- Expert-Level Tool: Crafted for investors, analysts, and business consultants.
- Easy to Use: Simple design and detailed guidance ensure accessibility for all users.
Who Can Benefit from This Product?
- Investors: Effectively assess the fair value of NatWest Group plc (NWGL) prior to making investment choices.
- CFOs: Utilize a professional-grade DCF model for accurate financial reporting and analysis.
- Consultants: Easily customize the template for client valuation reports.
- Entrepreneurs: Acquire knowledge on financial modeling practices used by leading companies.
- Educators: Employ it as a teaching resource to illustrate various valuation techniques.
Contents of the Template
- Preloaded NWGL Data: Historical and forecasted financial metrics, including revenue, EBIT, and capital expenditures.
- DCF and WACC Models: High-quality spreadsheets for calculating intrinsic value and Weighted Average Cost of Capital.
- Editable Inputs: Cells highlighted in yellow for adjusting revenue growth, tax rates, and discount rates.
- Financial Statements: Detailed annual and quarterly financial reports for in-depth analysis.
- Key Ratios: Ratios pertaining to profitability, leverage, and efficiency to assess performance.
- Dashboard and Charts: Visual representations of valuation results and underlying assumptions.
Disclaimer
All information, articles, and product details provided on this website are for general informational and educational purposes only. We do not claim any ownership over, nor do we intend to infringe upon, any trademarks, copyrights, logos, brand names, or other intellectual property mentioned or depicted on this site. Such intellectual property remains the property of its respective owners, and any references here are made solely for identification or informational purposes, without implying any affiliation, endorsement, or partnership.
We make no representations or warranties, express or implied, regarding the accuracy, completeness, or suitability of any content or products presented. Nothing on this website should be construed as legal, tax, investment, financial, medical, or other professional advice. In addition, no part of this site—including articles or product references—constitutes a solicitation, recommendation, endorsement, advertisement, or offer to buy or sell any securities, franchises, or other financial instruments, particularly in jurisdictions where such activity would be unlawful.
All content is of a general nature and may not address the specific circumstances of any individual or entity. It is not a substitute for professional advice or services. Any actions you take based on the information provided here are strictly at your own risk. You accept full responsibility for any decisions or outcomes arising from your use of this website and agree to release us from any liability in connection with your use of, or reliance upon, the content or products found herein.