
|
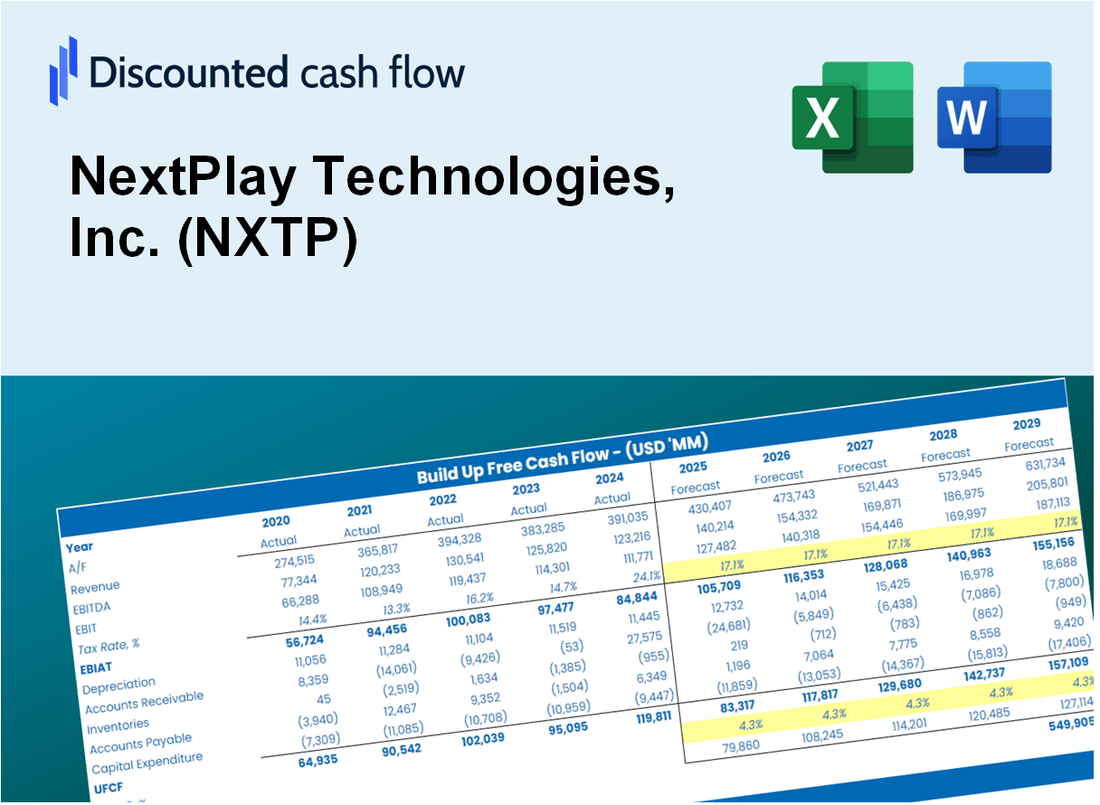
Nextplay Technologies, Inc. (NXTP) DCF -Bewertung |
Fully Editable: Tailor To Your Needs In Excel Or Sheets
Professional Design: Trusted, Industry-Standard Templates
Investor-Approved Valuation Models
MAC/PC Compatible, Fully Unlocked
No Expertise Is Needed; Easy To Follow
NextPlay Technologies, Inc. (NXTP) Bundle
Möchten Sie den inneren Wert von Nextplay Technologies, Inc. bewerten? Unser NXTP DCF-Taschenrechner integriert reale Daten mit umfangreichen Anpassungsfunktionen, sodass Sie Ihre Prognosen verfeinern und Ihre Anlagestrategien verbessern können.
What You Will Receive
- Customizable Excel Template: A fully adaptable Excel-based DCF Calculator featuring pre-filled real NXTP financials.
- Actual Data Insights: Historical performance data and forward-looking estimates (highlighted in the yellow cells).
- Flexible Forecasting: Adjust forecast parameters such as revenue growth, EBITDA %, and WACC.
- Instant Calculations: Quickly observe how your inputs influence NextPlay Technologies’ valuation.
- Professional Resource: Designed for investors, CFOs, consultants, and financial analysts.
- User-Friendly Interface: Organized for clarity and simplicity, complete with step-by-step guidance.
Key Features
- Customizable Financial Metrics: Adjust essential inputs such as user growth, revenue projections, and operational costs.
- Instant DCF Valuation: Automatically computes intrinsic value, NPV, and various financial metrics in real-time.
- High-Precision Results: Leverages NextPlay Technologies' actual financial data for accurate valuation assessments.
- Effortless Scenario Testing: Easily explore different assumptions and analyze results side by side.
- Efficiency Booster: Streamline the valuation process without the hassle of creating intricate models from the ground up.
How It Works
- Download: Obtain the ready-to-use Excel file containing NextPlay Technologies, Inc.'s (NXTP) financial data.
- Customize: Modify forecasts such as revenue growth, EBITDA %, and WACC to fit your analysis.
- Update Automatically: Watch as the intrinsic value and NPV calculations refresh in real-time.
- Test Scenarios: Generate various projections and instantly compare the results.
- Make Decisions: Leverage the valuation outcomes to inform your investment strategy.
Why Choose NextPlay Technologies, Inc. (NXTP) Calculator?
- Save Time: Skip the hassle of building a financial model from the ground up – it’s ready for immediate use.
- Enhance Accuracy: Dependable financial insights and formulas minimize valuation errors.
- Completely Customizable: Adjust the model to align with your unique assumptions and forecasts.
- Intuitive Design: User-friendly charts and outputs simplify result analysis.
- Endorsed by Professionals: Crafted for experts who prioritize precision and ease of use.
Who Should Use NextPlay Technologies, Inc. (NXTP)?
- Professional Investors: Develop comprehensive and accurate valuation models for evaluating investment opportunities.
- Corporate Finance Teams: Assess valuation scenarios to inform strategic decisions within the organization.
- Consultants and Advisors: Deliver precise valuation insights to clients interested in NextPlay Technologies, Inc. (NXTP).
- Students and Educators: Utilize current market data to enhance learning and teaching in financial modeling.
- Tech Enthusiasts: Gain insights into the valuation processes of innovative companies like NextPlay Technologies, Inc. (NXTP).
What the Template Contains
- Historical Data: Includes NextPlay Technologies, Inc.'s (NXTP) past financials and baseline forecasts.
- DCF and Levered DCF Models: Detailed templates to calculate NextPlay Technologies, Inc.'s (NXTP) intrinsic value.
- WACC Sheet: Pre-built calculations for Weighted Average Cost of Capital.
- Editable Inputs: Modify key drivers like growth rates, EBITDA %, and CAPEX assumptions.
- Quarterly and Annual Statements: A complete breakdown of NextPlay Technologies, Inc.'s (NXTP) financials.
- Interactive Dashboard: Visualize valuation results and projections dynamically.
Disclaimer
All information, articles, and product details provided on this website are for general informational and educational purposes only. We do not claim any ownership over, nor do we intend to infringe upon, any trademarks, copyrights, logos, brand names, or other intellectual property mentioned or depicted on this site. Such intellectual property remains the property of its respective owners, and any references here are made solely for identification or informational purposes, without implying any affiliation, endorsement, or partnership.
We make no representations or warranties, express or implied, regarding the accuracy, completeness, or suitability of any content or products presented. Nothing on this website should be construed as legal, tax, investment, financial, medical, or other professional advice. In addition, no part of this site—including articles or product references—constitutes a solicitation, recommendation, endorsement, advertisement, or offer to buy or sell any securities, franchises, or other financial instruments, particularly in jurisdictions where such activity would be unlawful.
All content is of a general nature and may not address the specific circumstances of any individual or entity. It is not a substitute for professional advice or services. Any actions you take based on the information provided here are strictly at your own risk. You accept full responsibility for any decisions or outcomes arising from your use of this website and agree to release us from any liability in connection with your use of, or reliance upon, the content or products found herein.