
|
Ocugen, Inc. (OCGN) DCF -Bewertung |
Fully Editable: Tailor To Your Needs In Excel Or Sheets
Professional Design: Trusted, Industry-Standard Templates
Investor-Approved Valuation Models
MAC/PC Compatible, Fully Unlocked
No Expertise Is Needed; Easy To Follow
Ocugen, Inc. (OCGN) Bundle
Egal, ob Sie ein Investor oder Analyst sind, dieser DCF-Taschenrechner von Ocugen, Inc. (OCGN) ist Ihr Anlaufwerk für eine genaue Bewertung. Es wird mit echten Daten von Ocugen vorgeladen, sodass Sie die Prognosen anpassen und die Auswirkungen in Echtzeit beobachten können.
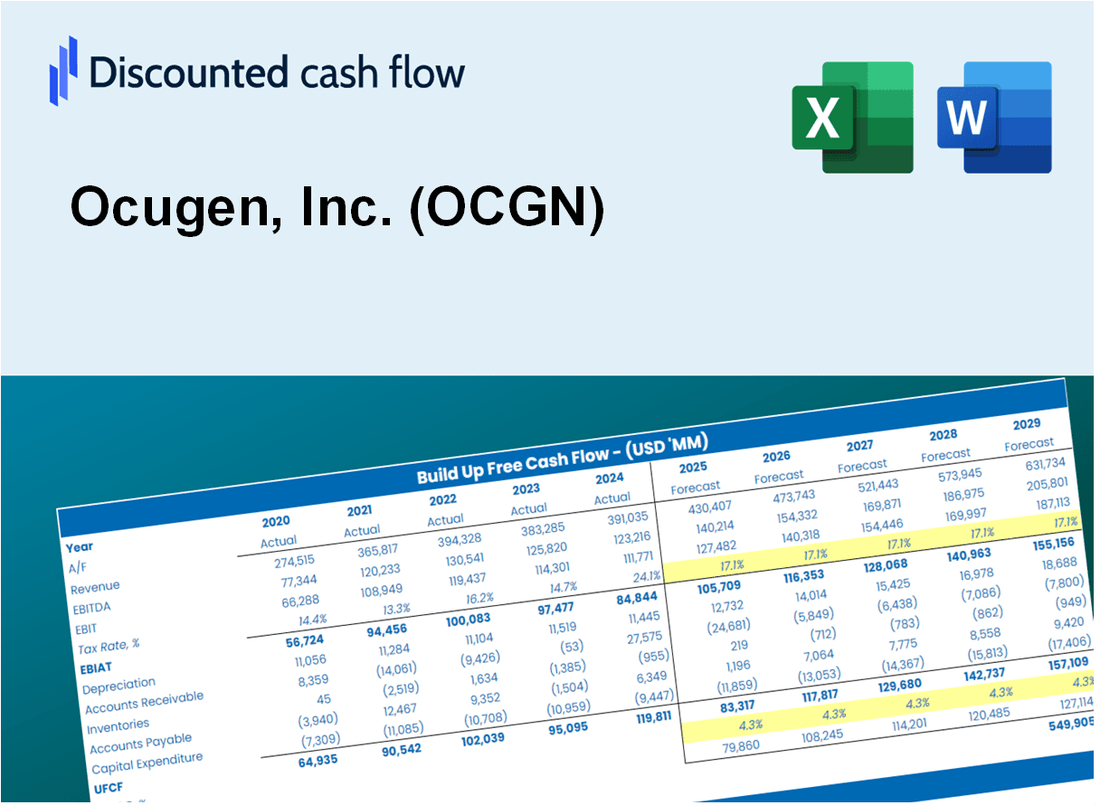
Discounted Cash Flow (DCF) - (USD MM)
| Year | AY1 2020 |
AY2 2021 |
AY3 2022 |
AY4 2023 |
AY5 2024 |
FY1 2025 |
FY2 2026 |
FY3 2027 |
FY4 2028 |
FY5 2029 |
|---|---|---|---|---|---|---|---|---|---|---|
| Revenue | .0 | .0 | 2.5 | 6.0 | 4.1 | 3.7 | 3.4 | 3.1 | 2.9 | 2.6 |
| Revenue Growth, % | 0 | -100 | 0 | 142.6 | -32.82 | -8.2 | -8.2 | -8.2 | -8.2 | -8.2 |
| EBITDA | -14.2 | -57.8 | -88.6 | -64.8 | -52.8 | -2.2 | -2.1 | -1.9 | -1.7 | -1.6 |
| EBITDA, % | -32983.72 | 100 | -3560.73 | -1074.01 | -1301.82 | -60 | -60 | -60 | -60 | -60 |
| Depreciation | .1 | .2 | .5 | .7 | 2.0 | 2.1 | 1.9 | 1.8 | 1.6 | 1.5 |
| Depreciation, % | 237.21 | 100 | 19.29 | 11.66 | 48.53 | 55.9 | 55.9 | 55.9 | 55.9 | 55.9 |
| EBIT | -14.3 | -58.0 | -89.1 | -65.5 | -54.8 | -2.2 | -2.1 | -1.9 | -1.7 | -1.6 |
| EBIT, % | -33220.93 | 100 | -3580.02 | -1085.67 | -1350.36 | -60 | -60 | -60 | -60 | -60 |
| Total Cash | 24.0 | 95.0 | 90.9 | 39.5 | 58.5 | 3.7 | 3.4 | 3.1 | 2.9 | 2.6 |
| Total Cash, percent | .1 | .0 | .0 | .0 | .0 | .0 | .0 | .0 | .0 | .0 |
| Account Receivables | .0 | .0 | .0 | .0 | .0 | .7 | .7 | .6 | .6 | .5 |
| Account Receivables, % | 0 | 100 | 0 | 0 | 0 | 20 | 20 | 20 | 20 | 20 |
| Inventories | .0 | .0 | .0 | .0 | .0 | .7 | .7 | .6 | .6 | .5 |
| Inventories, % | 0 | 100 | 0 | 0 | 0 | 20 | 20 | 20 | 20 | 20 |
| Accounts Payable | .4 | 2.3 | 8.1 | 3.2 | 4.2 | 3.4 | 3.1 | 2.8 | 2.6 | 2.4 |
| Accounts Payable, % | 918.6 | 100 | 324.04 | 52.55 | 104.64 | 90.51 | 90.51 | 90.51 | 90.51 | 90.51 |
| Capital Expenditure | -.3 | -.9 | -4.5 | -10.5 | -3.4 | -2.9 | -2.6 | -2.4 | -2.2 | -2.0 |
| Capital Expenditure, % | -713.55 | 100 | -179.14 | -173.56 | -83.48 | -76.7 | -76.7 | -76.7 | -76.7 | -76.7 |
| Tax Rate, % | 0 | 0 | 0 | 0 | 0 | 0 | 0 | 0 | 0 | 0 |
| EBITAT | -14.3 | -58.0 | -89.1 | -65.5 | -54.8 | -2.2 | -2.0 | -1.9 | -1.7 | -1.6 |
| Depreciation | ||||||||||
| Changes in Account Receivables | ||||||||||
| Changes in Inventories | ||||||||||
| Changes in Accounts Payable | ||||||||||
| Capital Expenditure | ||||||||||
| UFCF | -14.1 | -56.8 | -87.3 | -80.2 | -55.1 | -5.4 | -2.9 | -2.7 | -2.5 | -2.3 |
| WACC, % | 23.08 | 23.08 | 23.08 | 23.08 | 23.08 | 23.08 | 23.08 | 23.08 | 23.08 | 23.08 |
| PV UFCF | ||||||||||
| SUM PV UFCF | -9.6 | |||||||||
| Long Term Growth Rate, % | 2.00 | |||||||||
| Free cash flow (T + 1) | -2 | |||||||||
| Terminal Value | -11 | |||||||||
| Present Terminal Value | -4 | |||||||||
| Enterprise Value | -13 | |||||||||
| Net Debt | -26 | |||||||||
| Equity Value | 13 | |||||||||
| Diluted Shares Outstanding, MM | 271 | |||||||||
| Equity Value Per Share | 0.05 |
What You Will Get
- Pre-Filled Financial Model: Ocugen’s actual data allows for accurate DCF valuation.
- Full Forecast Control: Modify revenue growth, margins, WACC, and other essential drivers.
- Instant Calculations: Real-time updates ensure you see the outcomes as you make adjustments.
- Investor-Ready Template: A polished Excel file crafted for professional-level valuation.
- Customizable and Reusable: Designed for adaptability, enabling repeated use for in-depth forecasts.
Key Features
- Comprehensive DCF Calculator: Offers detailed unlevered and levered DCF valuation models tailored for Ocugen, Inc. (OCGN).
- WACC Calculator: Features a pre-built Weighted Average Cost of Capital sheet with adjustable inputs specific to Ocugen, Inc. (OCGN).
- Customizable Forecast Assumptions: Adjust growth rates, capital expenditures, and discount rates to suit Ocugen, Inc. (OCGN).
- Integrated Financial Ratios: Evaluate profitability, leverage, and efficiency ratios relevant to Ocugen, Inc. (OCGN).
- Interactive Dashboard and Charts: Visual presentations summarize essential valuation metrics for streamlined analysis of Ocugen, Inc. (OCGN).
How It Works
- Download the Template: Obtain immediate access to the Excel-based OCGN DCF Calculator.
- Input Your Assumptions: Modify the yellow-highlighted cells for growth rates, WACC, margins, and other variables.
- Instant Calculations: The model automatically recalculates Ocugen’s intrinsic value.
- Test Scenarios: Experiment with different assumptions to assess potential valuation shifts.
- Analyze and Decide: Leverage the results to inform your investment or financial strategy.
Why Choose This Calculator for Ocugen, Inc. (OCGN)?
- Accurate Data: Real Ocugen financials ensure reliable valuation results.
- Customizable: Adjust key parameters like growth rates, WACC, and tax rates to align with your projections.
- Time-Saving: Pre-built calculations save you from starting from scratch.
- Professional-Grade Tool: Tailored for investors, analysts, and consultants in the biotech sector.
- User-Friendly: Intuitive design and step-by-step guidance make it accessible for all users.
Who Should Use Ocugen, Inc. (OCGN)?
- Investors: Make informed decisions with insights from a leading biopharmaceutical company.
- Healthcare Analysts: Analyze market trends and opportunities in the gene therapy sector.
- Consultants: Customize reports and presentations based on Ocugen's innovative pipeline.
- Biotech Enthusiasts: Enhance your knowledge of cutting-edge therapies and their impact on patient care.
- Educators and Students: Utilize Ocugen's developments as case studies in biotechnology and pharmaceutical courses.
What the Ocugen, Inc. (OCGN) Template Contains
- Comprehensive DCF Model: Editable template featuring detailed valuation calculations tailored for Ocugen, Inc.
- Real-World Data: Ocugen’s historical and projected financials preloaded for in-depth analysis.
- Customizable Parameters: Modify WACC, growth rates, and tax assumptions to explore various scenarios.
- Financial Statements: Complete annual and quarterly breakdowns for enhanced insights into performance.
- Key Ratios: Integrated analysis for assessing profitability, efficiency, and leverage metrics.
- Dashboard with Visual Outputs: Interactive charts and tables providing clear, actionable results.
Disclaimer
All information, articles, and product details provided on this website are for general informational and educational purposes only. We do not claim any ownership over, nor do we intend to infringe upon, any trademarks, copyrights, logos, brand names, or other intellectual property mentioned or depicted on this site. Such intellectual property remains the property of its respective owners, and any references here are made solely for identification or informational purposes, without implying any affiliation, endorsement, or partnership.
We make no representations or warranties, express or implied, regarding the accuracy, completeness, or suitability of any content or products presented. Nothing on this website should be construed as legal, tax, investment, financial, medical, or other professional advice. In addition, no part of this site—including articles or product references—constitutes a solicitation, recommendation, endorsement, advertisement, or offer to buy or sell any securities, franchises, or other financial instruments, particularly in jurisdictions where such activity would be unlawful.
All content is of a general nature and may not address the specific circumstances of any individual or entity. It is not a substitute for professional advice or services. Any actions you take based on the information provided here are strictly at your own risk. You accept full responsibility for any decisions or outcomes arising from your use of this website and agree to release us from any liability in connection with your use of, or reliance upon, the content or products found herein.