
|
On24, Inc. (ONTF) DCF -Bewertung |
Fully Editable: Tailor To Your Needs In Excel Or Sheets
Professional Design: Trusted, Industry-Standard Templates
Investor-Approved Valuation Models
MAC/PC Compatible, Fully Unlocked
No Expertise Is Needed; Easy To Follow
ON24, Inc. (ONTF) Bundle
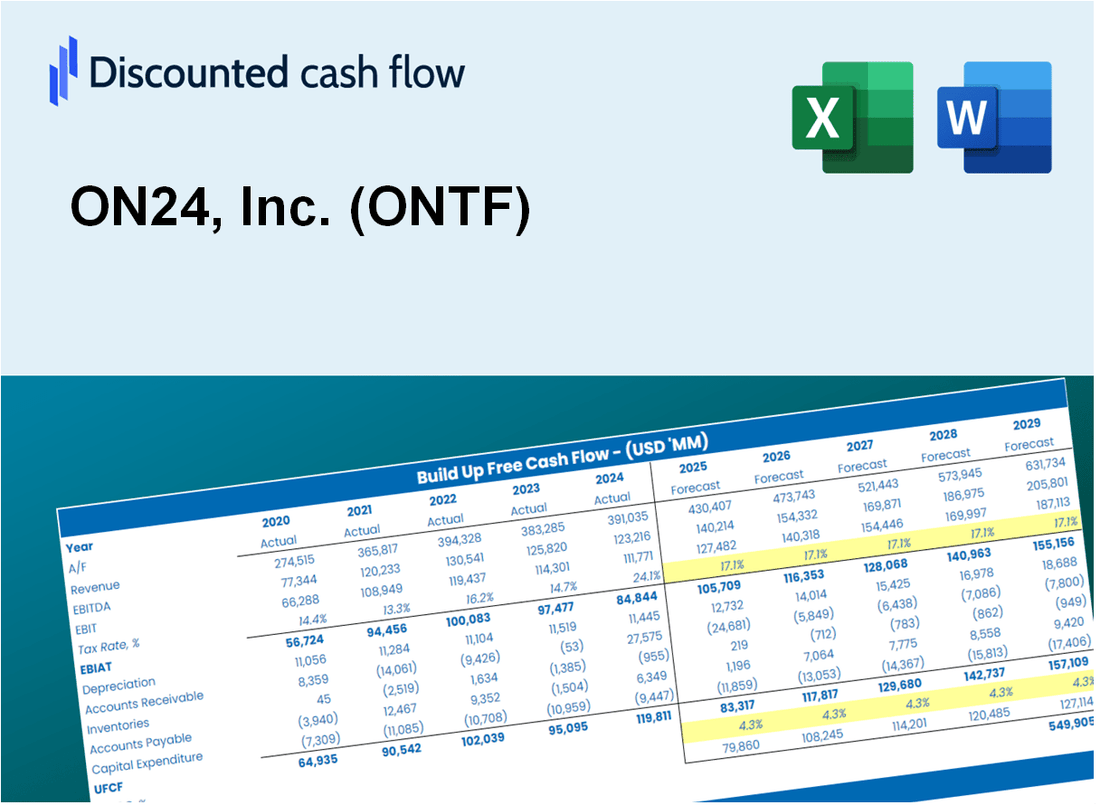
Gewinnen Sie mit unserem ausgeklügelten DCF -Taschenrechner die Meisterschaft über Ihre ON24, Inc. (ONTF) -Schanganalyse! Diese Excel -Vorlage wird mit realen ONTF -Daten vorinstalliert, sodass Sie Prognosen und Annahmen anpassen können, um den inneren Wert von ON24, Inc. (ONTF) genau zu bestimmen.
Discounted Cash Flow (DCF) - (USD MM)
| Year | AY1 2020 |
AY2 2021 |
AY3 2022 |
AY4 2023 |
AY5 2024 |
FY1 2025 |
FY2 2026 |
FY3 2027 |
FY4 2028 |
FY5 2029 |
|---|---|---|---|---|---|---|---|---|---|---|
| Revenue | 156.9 | 203.6 | 190.9 | 163.7 | 148.1 | 148.0 | 147.9 | 147.8 | 147.6 | 147.5 |
| Revenue Growth, % | 0 | 29.74 | -6.26 | -14.23 | -9.55 | -0.07401904 | -0.07401904 | -0.07401904 | -0.07401904 | -0.07401904 |
| EBITDA | 24.9 | -19.5 | -49.7 | -45.3 | -36.7 | -21.4 | -21.3 | -21.3 | -21.3 | -21.3 |
| EBITDA, % | 15.86 | -9.57 | -26.03 | -27.69 | -24.76 | -14.44 | -14.44 | -14.44 | -14.44 | -14.44 |
| Depreciation | 3.0 | 4.6 | 7.4 | 5.4 | 4.8 | 4.3 | 4.3 | 4.3 | 4.3 | 4.3 |
| Depreciation, % | 1.89 | 2.26 | 3.87 | 3.27 | 3.26 | 2.91 | 2.91 | 2.91 | 2.91 | 2.91 |
| EBIT | 21.9 | -24.1 | -57.1 | -50.7 | -41.5 | -25.7 | -25.7 | -25.6 | -25.6 | -25.6 |
| EBIT, % | 13.97 | -11.82 | -29.9 | -30.97 | -28.02 | -17.35 | -17.35 | -17.35 | -17.35 | -17.35 |
| Total Cash | 61.2 | 382.6 | 328.1 | 198.7 | 182.7 | 129.9 | 129.8 | 129.7 | 129.6 | 129.5 |
| Total Cash, percent | .0 | .0 | .0 | .0 | .0 | .0 | .0 | .0 | .0 | .0 |
| Account Receivables | 49.5 | 46.1 | 43.8 | 37.9 | 28.6 | 35.4 | 35.4 | 35.3 | 35.3 | 35.3 |
| Account Receivables, % | 31.53 | 22.65 | 22.92 | 23.17 | 19.32 | 23.92 | 23.92 | 23.92 | 23.92 | 23.92 |
| Inventories | 10.5 | .0 | .0 | .0 | .0 | 2.0 | 2.0 | 2.0 | 2.0 | 2.0 |
| Inventories, % | 6.71 | 0 | 0 | 0 | 0 | 1.34 | 1.34 | 1.34 | 1.34 | 1.34 |
| Accounts Payable | 4.7 | 3.1 | 4.6 | 1.9 | 2.7 | 3.0 | 3.0 | 3.0 | 2.9 | 2.9 |
| Accounts Payable, % | 3.01 | 1.53 | 2.42 | 1.17 | 1.85 | 2 | 2 | 2 | 2 | 2 |
| Capital Expenditure | -1.0 | -3.6 | -3.7 | -2.2 | -2.2 | -2.1 | -2.1 | -2.1 | -2.1 | -2.1 |
| Capital Expenditure, % | -0.6563 | -1.75 | -1.94 | -1.33 | -1.51 | -1.44 | -1.44 | -1.44 | -1.44 | -1.44 |
| Tax Rate, % | -1.52 | -1.52 | -1.52 | -1.52 | -1.52 | -1.52 | -1.52 | -1.52 | -1.52 | -1.52 |
| EBITAT | 21.6 | -23.8 | -58.0 | -51.7 | -42.1 | -25.5 | -25.5 | -25.5 | -25.5 | -25.5 |
| Depreciation | ||||||||||
| Changes in Account Receivables | ||||||||||
| Changes in Inventories | ||||||||||
| Changes in Accounts Payable | ||||||||||
| Capital Expenditure | ||||||||||
| UFCF | -31.7 | -10.5 | -50.5 | -45.4 | -29.4 | -31.9 | -23.3 | -23.3 | -23.3 | -23.3 |
| WACC, % | 6.88 | 6.88 | 6.88 | 6.88 | 6.88 | 6.88 | 6.88 | 6.88 | 6.88 | 6.88 |
| PV UFCF | ||||||||||
| SUM PV UFCF | -103.9 | |||||||||
| Long Term Growth Rate, % | 2.00 | |||||||||
| Free cash flow (T + 1) | -24 | |||||||||
| Terminal Value | -487 | |||||||||
| Present Terminal Value | -349 | |||||||||
| Enterprise Value | -453 | |||||||||
| Net Debt | -12 | |||||||||
| Equity Value | -441 | |||||||||
| Diluted Shares Outstanding, MM | 42 | |||||||||
| Equity Value Per Share | -10.57 |
What You Will Get
- Real ONTF Financials: Access to historical and projected data for precise valuation.
- Customizable Inputs: Adjust WACC, tax rates, revenue growth, and capital expenditures as needed.
- Dynamic Calculations: Intrinsic value and NPV are computed automatically.
- Scenario Analysis: Evaluate various scenarios to assess ON24’s future performance.
- User-Friendly Design: Tailored for professionals while remaining easy to use for newcomers.
Key Features
- 🔍 Real-Life ONTF Financials: Pre-filled historical and projected data for ON24, Inc.
- ✏️ Fully Customizable Inputs: Adjust all critical parameters (yellow cells) like WACC, growth %, and tax rates.
- 📊 Professional DCF Valuation: Built-in formulas calculate ON24’s intrinsic value using the Discounted Cash Flow method.
- ⚡ Instant Results: Visualize ON24’s valuation instantly after making changes.
- Scenario Analysis: Test and compare outcomes for various financial assumptions side-by-side.
How It Works
- Step 1: Download the prebuilt Excel template featuring ON24, Inc.'s (ONTF) data.
- Step 2: Review the pre-filled sheets to familiarize yourself with the essential metrics.
- Step 3: Modify forecasts and assumptions in the editable yellow cells (WACC, growth, margins).
- Step 4: Instantly see recalculated results, including ON24, Inc.'s (ONTF) intrinsic value.
- Step 5: Use the outputs to make informed investment decisions or create reports.
Why Choose ON24, Inc. (ONTF)?
- Enhance Engagement: Leverage interactive webinars and virtual events to captivate your audience.
- Data-Driven Insights: Access robust analytics to measure performance and optimize strategies.
- Seamless Integration: Easily connect with your existing marketing and sales tools for a streamlined workflow.
- User-Friendly Interface: Intuitive design ensures a smooth experience for both presenters and attendees.
- Industry-Leading Support: Benefit from dedicated support and resources to maximize your platform usage.
Who Should Use This Product?
- Investors: Accurately assess ON24, Inc.'s (ONTF) market potential before making investment choices.
- CFOs: Utilize a comprehensive DCF model for precise financial reporting and analysis.
- Consultants: Easily modify the template for client valuation reports related to ON24, Inc. (ONTF).
- Entrepreneurs: Discover financial modeling techniques employed by leading tech companies.
- Educators: Implement it as a resource to teach valuation methods effectively.
What the Template Contains
- Historical Data: Includes ON24, Inc.’s past financials and baseline forecasts.
- DCF and Levered DCF Models: Detailed templates to calculate ON24, Inc.’s intrinsic value.
- WACC Sheet: Pre-built calculations for Weighted Average Cost of Capital.
- Editable Inputs: Modify key drivers like growth rates, EBITDA %, and CAPEX assumptions.
- Quarterly and Annual Statements: A complete breakdown of ON24, Inc.’s financials.
- Interactive Dashboard: Visualize valuation results and projections dynamically.
Disclaimer
All information, articles, and product details provided on this website are for general informational and educational purposes only. We do not claim any ownership over, nor do we intend to infringe upon, any trademarks, copyrights, logos, brand names, or other intellectual property mentioned or depicted on this site. Such intellectual property remains the property of its respective owners, and any references here are made solely for identification or informational purposes, without implying any affiliation, endorsement, or partnership.
We make no representations or warranties, express or implied, regarding the accuracy, completeness, or suitability of any content or products presented. Nothing on this website should be construed as legal, tax, investment, financial, medical, or other professional advice. In addition, no part of this site—including articles or product references—constitutes a solicitation, recommendation, endorsement, advertisement, or offer to buy or sell any securities, franchises, or other financial instruments, particularly in jurisdictions where such activity would be unlawful.
All content is of a general nature and may not address the specific circumstances of any individual or entity. It is not a substitute for professional advice or services. Any actions you take based on the information provided here are strictly at your own risk. You accept full responsibility for any decisions or outcomes arising from your use of this website and agree to release us from any liability in connection with your use of, or reliance upon, the content or products found herein.