
|
Organovo Holdings, Inc. (ONVO) DCF -Bewertung |
Fully Editable: Tailor To Your Needs In Excel Or Sheets
Professional Design: Trusted, Industry-Standard Templates
Investor-Approved Valuation Models
MAC/PC Compatible, Fully Unlocked
No Expertise Is Needed; Easy To Follow
Organovo Holdings, Inc. (ONVO) Bundle
Explore Organovo Holdings, Inc. (ONVO) Finanzielle Zukunft mit unserem benutzerfreundlichen DCF-Taschenrechner! Geben Sie Ihre Prognosen für Wachstum, Margen und Kosten ein, um den inneren Wert von Organovo Holdings, Inc. (ONVO) zu berechnen und Ihren Investitionsansatz zu verfeinern.
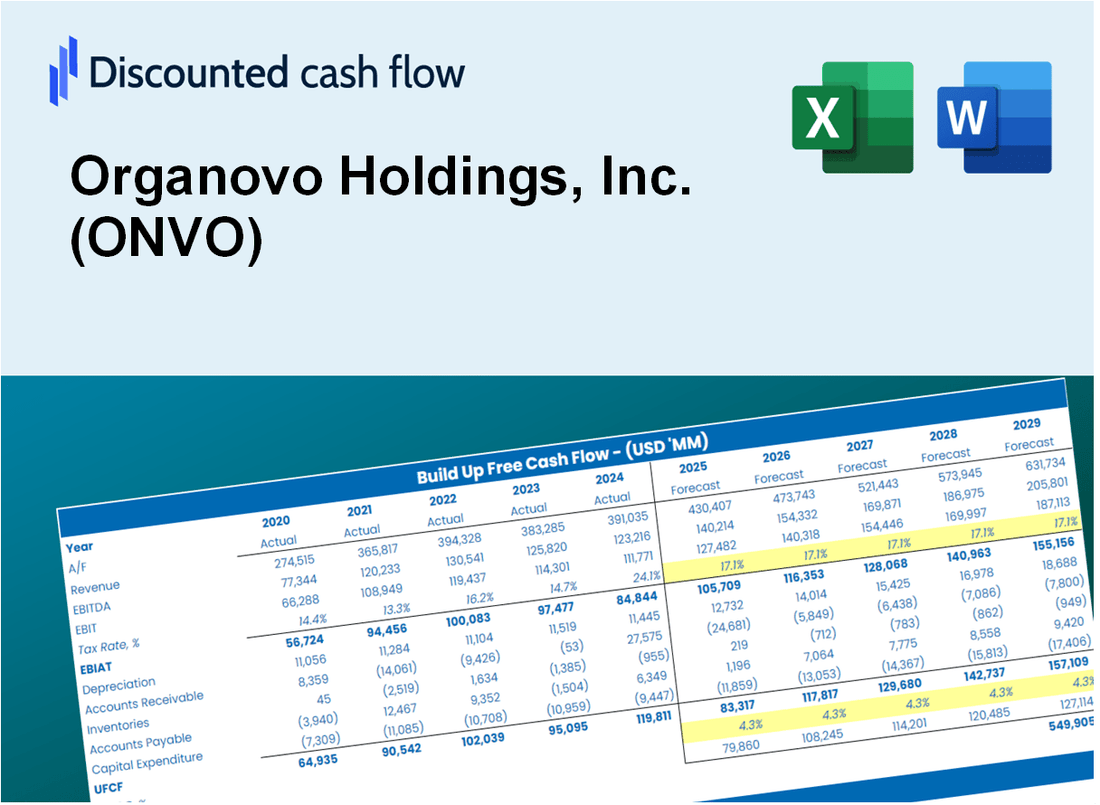
Discounted Cash Flow (DCF) - (USD MM)
| Year | AY1 2019 |
AY2 2020 |
AY3 2021 |
AY4 2022 |
AY5 2023 |
FY1 2024 |
FY2 2025 |
FY3 2026 |
FY4 2027 |
FY5 2028 |
|---|---|---|---|---|---|---|---|---|---|---|
| Revenue | 2.2 | .0 | 1.5 | .4 | .1 | .0 | .0 | .0 | .0 | .0 |
| Revenue Growth, % | 0 | -100 | 0 | -75.33 | -70.54 | -61.47 | -61.47 | -61.47 | -61.47 | -61.47 |
| EBITDA | -20.3 | -16.8 | -11.3 | -17.4 | -14.8 | .0 | .0 | .0 | .0 | .0 |
| EBITDA, % | -925.91 | 100 | -755.8 | -4712.97 | -13583.49 | -60 | -60 | -60 | -60 | -60 |
| Depreciation | 1.1 | .0 | .1 | .3 | .3 | .0 | .0 | .0 | .0 | .0 |
| Depreciation, % | 52 | 100 | 9.47 | 79.19 | 256.88 | 68.13 | 68.13 | 68.13 | 68.13 | 68.13 |
| EBIT | -21.5 | -16.8 | -11.5 | -17.7 | -15.1 | .0 | .0 | .0 | .0 | .0 |
| EBIT, % | -977.91 | 100 | -765.27 | -4792.16 | -13840.37 | -60 | -60 | -60 | -60 | -60 |
| Total Cash | 27.4 | 37.4 | 28.7 | 16.0 | 2.9 | .0 | .0 | .0 | .0 | .0 |
| Total Cash, percent | .0 | .0 | .0 | .0 | .0 | .0 | .0 | .0 | .0 | .0 |
| Account Receivables | .1 | .0 | .0 | .2 | .0 | .0 | .0 | .0 | .0 | .0 |
| Account Receivables, % | 5.05 | 100 | 0 | 41.08 | 30.28 | 35.28 | 35.28 | 35.28 | 35.28 | 35.28 |
| Inventories | .0 | .0 | .0 | .0 | .3 | .0 | .0 | .0 | .0 | .0 |
| Inventories, % | 0.000045537341 | 100 | 0 | 0.00027027027 | 272.48 | 40 | 40 | 40 | 40 | 40 |
| Accounts Payable | .7 | .3 | .4 | .3 | .6 | .0 | .0 | .0 | .0 | .0 |
| Accounts Payable, % | 32.79 | 100 | 27.67 | 89.46 | 575.23 | 69.98 | 69.98 | 69.98 | 69.98 | 69.98 |
| Capital Expenditure | .0 | -.4 | -.4 | -.4 | .0 | .0 | .0 | .0 | .0 | .0 |
| Capital Expenditure, % | 0 | 100 | -27.27 | -107.03 | -38.53 | -33.16 | -33.16 | -33.16 | -33.16 | -33.16 |
| Tax Rate, % | -0.01363419 | -0.01363419 | -0.01363419 | -0.01363419 | -0.01363419 | -0.01363419 | -0.01363419 | -0.01363419 | -0.01363419 | -0.01363419 |
| EBITAT | -21.5 | -16.8 | -11.5 | -17.7 | -15.1 | .0 | .0 | .0 | .0 | .0 |
| Depreciation | ||||||||||
| Changes in Account Receivables | ||||||||||
| Changes in Inventories | ||||||||||
| Changes in Accounts Payable | ||||||||||
| Capital Expenditure | ||||||||||
| UFCF | -19.7 | -17.5 | -11.6 | -18.1 | -14.7 | -.3 | .0 | .0 | .0 | .0 |
| WACC, % | 8.86 | 8.86 | 8.86 | 8.86 | 8.86 | 8.86 | 8.86 | 8.86 | 8.86 | 8.86 |
| PV UFCF | ||||||||||
| SUM PV UFCF | -.3 | |||||||||
| Long Term Growth Rate, % | 2.00 | |||||||||
| Free cash flow (T + 1) | 0 | |||||||||
| Terminal Value | 0 | |||||||||
| Present Terminal Value | 0 | |||||||||
| Enterprise Value | 0 | |||||||||
| Net Debt | -2 | |||||||||
| Equity Value | 1 | |||||||||
| Diluted Shares Outstanding, MM | 9 | |||||||||
| Equity Value Per Share | 0.13 |
What You Will Get
- Pre-Filled Financial Model: Utilize Organovo’s actual data for accurate DCF valuation.
- Full Forecast Control: Modify revenue growth, profit margins, WACC, and other critical parameters.
- Instant Calculations: Real-time updates provide immediate feedback as you adjust inputs.
- Investor-Ready Template: A polished Excel file crafted for high-quality valuation presentations.
- Customizable and Reusable: Designed for adaptability, allowing for repeated application in comprehensive forecasts.
Key Features
- 🔍 Real-Life ONVO Financials: Pre-filled historical and projected data for Organovo Holdings, Inc. (ONVO).
- ✏️ Fully Customizable Inputs: Adjust all critical parameters (yellow cells) like WACC, growth %, and tax rates.
- 📊 Professional DCF Valuation: Built-in formulas calculate Organovo's intrinsic value using the Discounted Cash Flow method.
- ⚡ Instant Results: Visualize Organovo's valuation instantly after making changes.
- Scenario Analysis: Test and compare outcomes for various financial assumptions side-by-side.
How It Works
- Step 1: Download the Excel file for Organovo Holdings, Inc. (ONVO).
- Step 2: Review Organovo's pre-filled financial data and projections.
- Step 3: Adjust key inputs such as revenue growth, WACC, and tax rates (highlighted cells).
- Step 4: Observe the DCF model refresh in real-time as you modify assumptions.
- Step 5: Evaluate the outputs and leverage the results for investment strategies.
Why Choose This Calculator for Organovo Holdings, Inc. (ONVO)?
- Designed for Experts: A specialized tool utilized by researchers, investment analysts, and healthcare consultants.
- Accurate Data: Organovo’s historical and projected financials are preloaded to ensure precision.
- Flexible Scenario Analysis: Effortlessly test various forecasts and assumptions.
- Comprehensive Outputs: Automatically computes intrinsic value, NPV, and essential financial metrics.
- User-Friendly: Step-by-step guidance makes the process straightforward.
Who Should Use This Product?
- Investors: Accurately estimate Organovo Holdings, Inc.'s (ONVO) fair value before making investment decisions.
- CFOs: Utilize a professional-grade DCF model for financial reporting and analysis related to Organovo Holdings, Inc. (ONVO).
- Consultants: Quickly adapt the template for valuation reports tailored to Organovo Holdings, Inc. (ONVO) clients.
- Entrepreneurs: Gain insights into financial modeling strategies employed by leading biotech firms like Organovo Holdings, Inc. (ONVO).
- Educators: Use it as a teaching tool to demonstrate valuation methodologies relevant to Organovo Holdings, Inc. (ONVO).
What the Template Contains
- Preloaded ONVO Data: Historical and projected financial data, including revenue, EBIT, and capital expenditures.
- DCF and WACC Models: Professional-grade sheets for calculating intrinsic value and Weighted Average Cost of Capital.
- Editable Inputs: Yellow-highlighted cells for adjusting revenue growth, tax rates, and discount rates.
- Financial Statements: Comprehensive annual and quarterly financials for deeper analysis.
- Key Ratios: Profitability, leverage, and efficiency ratios to evaluate performance.
- Dashboard and Charts: Visual summaries of valuation outcomes and assumptions.
Disclaimer
All information, articles, and product details provided on this website are for general informational and educational purposes only. We do not claim any ownership over, nor do we intend to infringe upon, any trademarks, copyrights, logos, brand names, or other intellectual property mentioned or depicted on this site. Such intellectual property remains the property of its respective owners, and any references here are made solely for identification or informational purposes, without implying any affiliation, endorsement, or partnership.
We make no representations or warranties, express or implied, regarding the accuracy, completeness, or suitability of any content or products presented. Nothing on this website should be construed as legal, tax, investment, financial, medical, or other professional advice. In addition, no part of this site—including articles or product references—constitutes a solicitation, recommendation, endorsement, advertisement, or offer to buy or sell any securities, franchises, or other financial instruments, particularly in jurisdictions where such activity would be unlawful.
All content is of a general nature and may not address the specific circumstances of any individual or entity. It is not a substitute for professional advice or services. Any actions you take based on the information provided here are strictly at your own risk. You accept full responsibility for any decisions or outcomes arising from your use of this website and agree to release us from any liability in connection with your use of, or reliance upon, the content or products found herein.