
|
Orgenesis Inc. (ORGS) DCF -Bewertung |
Fully Editable: Tailor To Your Needs In Excel Or Sheets
Professional Design: Trusted, Industry-Standard Templates
Investor-Approved Valuation Models
MAC/PC Compatible, Fully Unlocked
No Expertise Is Needed; Easy To Follow
Orgenesis Inc. (ORGS) Bundle
Unabhängig davon, ob Sie ein Investor oder Analyst sind, ist dieser (ORGS) DCF-Taschenrechner Ihre Anlaufstelle für eine genaue Bewertung. Ausgestattet mit realen Daten von Orgenesis Inc. können Sie Prognosen anpassen und die Auswirkungen sofort beobachten.
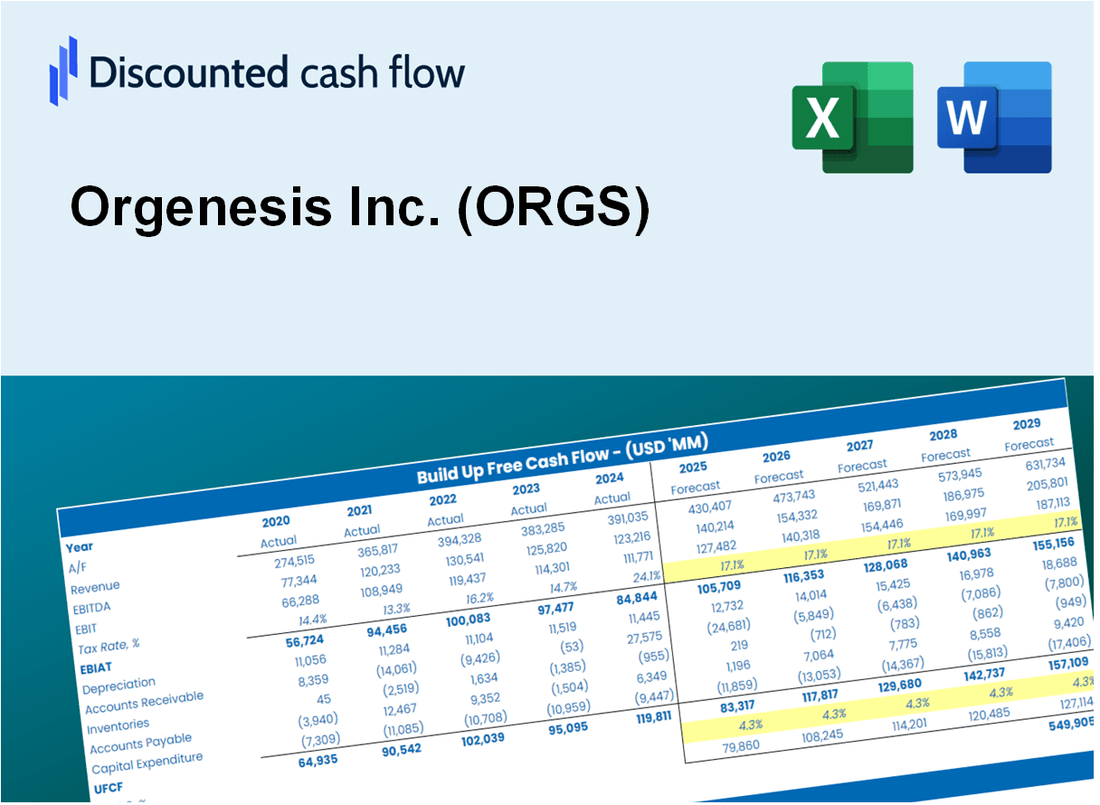
Discounted Cash Flow (DCF) - (USD MM)
| Year | AY1 2019 |
AY2 2020 |
AY3 2021 |
AY4 2022 |
AY5 2023 |
FY1 2024 |
FY2 2025 |
FY3 2026 |
FY4 2027 |
FY5 2028 |
|---|---|---|---|---|---|---|---|---|---|---|
| Revenue | 33.3 | 7.7 | 35.5 | 36.0 | .5 | .4 | .4 | .3 | .2 | .2 |
| Revenue Growth, % | 0 | -76.99 | 363.96 | 1.47 | -98.53 | -18.51 | -18.51 | -18.51 | -18.51 | -18.51 |
| EBITDA | -18.9 | -94.2 | -15.7 | -8.2 | -60.7 | -.3 | -.2 | -.2 | -.2 | -.1 |
| EBITDA, % | -56.86 | -1231.14 | -44.27 | -22.65 | -11456.23 | -64.76 | -64.76 | -64.76 | -64.76 | -64.76 |
| Depreciation | 3.8 | 1.4 | 1.9 | 2.0 | 1.6 | .1 | .1 | .1 | .1 | .1 |
| Depreciation, % | 11.44 | 18.75 | 5.25 | 5.49 | 294.34 | 28.19 | 28.19 | 28.19 | 28.19 | 28.19 |
| EBIT | -22.7 | -95.6 | -17.6 | -10.1 | -62.3 | -.3 | -.2 | -.2 | -.2 | -.1 |
| EBIT, % | -68.3 | -1249.9 | -49.52 | -28.14 | -11750.57 | -69.19 | -69.19 | -69.19 | -69.19 | -69.19 |
| Total Cash | 11.4 | 44.9 | 5.5 | 5.3 | .8 | .2 | .2 | .2 | .1 | .1 |
| Total Cash, percent | .0 | .0 | .0 | .0 | .0 | .0 | .0 | .0 | .0 | .0 |
| Account Receivables | 2.0 | 3.3 | 19.7 | 39.8 | 2.6 | .3 | .2 | .2 | .1 | .1 |
| Account Receivables, % | 6.12 | 42.52 | 55.39 | 110.56 | 483.58 | 60.81 | 60.81 | 60.81 | 60.81 | 60.81 |
| Inventories | 2.0 | .2 | .1 | .1 | .0 | .0 | .0 | .0 | .0 | .0 |
| Inventories, % | 6.14 | 2.42 | 0.33238 | 0.3331 | 6.42 | 3.13 | 3.13 | 3.13 | 3.13 | 3.13 |
| Accounts Payable | 5.5 | 8.6 | 5.2 | 4.4 | 6.6 | .2 | .2 | .1 | .1 | .1 |
| Accounts Payable, % | 16.69 | 113.03 | 14.75 | 12.29 | 1242.26 | 48.75 | 48.75 | 48.75 | 48.75 | 48.75 |
| Capital Expenditure | -12.1 | -1.5 | -7.9 | -12.4 | -2.1 | -.2 | -.1 | -.1 | -.1 | -.1 |
| Capital Expenditure, % | -36.47 | -19.93 | -22.16 | -34.46 | -395.47 | -42.6 | -42.6 | -42.6 | -42.6 | -42.6 |
| Tax Rate, % | 14.1 | 14.1 | 14.1 | 14.1 | 14.1 | 14.1 | 14.1 | 14.1 | 14.1 | 14.1 |
| EBITAT | -23.2 | -94.7 | -17.7 | -12.6 | -53.5 | -.3 | -.2 | -.2 | -.2 | -.1 |
| Depreciation | ||||||||||
| Changes in Account Receivables | ||||||||||
| Changes in Inventories | ||||||||||
| Changes in Accounts Payable | ||||||||||
| Capital Expenditure | ||||||||||
| UFCF | -30.1 | -91.1 | -43.4 | -44.0 | -14.5 | -4.4 | -.3 | -.2 | -.2 | -.1 |
| WACC, % | 11.47 | 11.4 | 11.47 | 11.47 | 10.4 | 11.24 | 11.24 | 11.24 | 11.24 | 11.24 |
| PV UFCF | ||||||||||
| SUM PV UFCF | -4.6 | |||||||||
| Long Term Growth Rate, % | 2.00 | |||||||||
| Free cash flow (T + 1) | 0 | |||||||||
| Terminal Value | -2 | |||||||||
| Present Terminal Value | -1 | |||||||||
| Enterprise Value | -6 | |||||||||
| Net Debt | 22 | |||||||||
| Equity Value | -27 | |||||||||
| Diluted Shares Outstanding, MM | 29 | |||||||||
| Equity Value Per Share | -0.94 |
What You Will Get
- Real Orgenesis Data: Preloaded financials – from revenue to EBIT – based on actual and projected figures.
- Full Customization: Adjust all critical parameters (yellow cells) like WACC, growth %, and tax rates.
- Instant Valuation Updates: Automatic recalculations to analyze the impact of changes on Orgenesis’s fair value.
- Versatile Excel Template: Tailored for quick edits, scenario testing, and detailed projections.
- Time-Saving and Accurate: Skip building models from scratch while maintaining precision and flexibility.
Key Features
- Comprehensive Financial Data: Gain access to precise historical figures and future forecasts for Orgenesis Inc. (ORGS).
- Adjustable Projection Parameters: Modify highlighted fields such as WACC, growth rates, and profit margins.
- Real-Time Calculations: Instant updates for DCF, Net Present Value (NPV), and cash flow assessments.
- Interactive Visual Dashboard: User-friendly charts and summaries to help you interpret your valuation findings.
- Designed for All Skill Levels: An intuitive layout tailored for investors, CFOs, and consultants alike.
How It Works
- Step 1: Download the Excel file.
- Step 2: Review pre-entered Orgenesis Inc. (ORGS) data (historical and projected).
- Step 3: Adjust key assumptions (yellow cells) based on your analysis.
- Step 4: View automatic recalculations for Orgenesis Inc. (ORGS)'s intrinsic value.
- Step 5: Use the outputs for investment decisions or reporting.
Why Choose Orgenesis Inc. (ORGS) Calculator?
- Comprehensive Tool: Offers advanced analytics including DCF, WACC, and financial ratio assessments all in one platform.
- Customizable Inputs: Modify the highlighted cells to explore different financial scenarios.
- Detailed Insights: Automatically computes Orgenesis Inc.’s intrinsic value and Net Present Value.
- Preloaded Data: Features historical and projected data to provide reliable starting points.
- Professional Quality: Perfect for financial analysts, investors, and business advisors.
Who Should Use This Product?
- Individual Investors: Make informed decisions about buying or selling Orgenesis Inc. (ORGS) stock.
- Financial Analysts: Streamline valuation processes with ready-to-use financial models specific to Orgenesis Inc. (ORGS).
- Consultants: Deliver professional valuation insights on Orgenesis Inc. (ORGS) to clients quickly and accurately.
- Business Owners: Understand how biopharmaceutical companies like Orgenesis Inc. (ORGS) are valued to guide your own strategy.
- Finance Students: Learn valuation techniques using real-world data and scenarios related to Orgenesis Inc. (ORGS).
What the Orgenesis Inc. Template Contains
- Preloaded ORGS Data: Historical and projected financial data, including revenue, EBIT, and capital expenditures.
- DCF and WACC Models: Professional-grade sheets for calculating intrinsic value and Weighted Average Cost of Capital.
- Editable Inputs: Yellow-highlighted cells for adjusting revenue growth, tax rates, and discount rates.
- Financial Statements: Comprehensive annual and quarterly financials for deeper analysis.
- Key Ratios: Profitability, leverage, and efficiency ratios to evaluate performance.
- Dashboard and Charts: Visual summaries of valuation outcomes and assumptions.
Disclaimer
All information, articles, and product details provided on this website are for general informational and educational purposes only. We do not claim any ownership over, nor do we intend to infringe upon, any trademarks, copyrights, logos, brand names, or other intellectual property mentioned or depicted on this site. Such intellectual property remains the property of its respective owners, and any references here are made solely for identification or informational purposes, without implying any affiliation, endorsement, or partnership.
We make no representations or warranties, express or implied, regarding the accuracy, completeness, or suitability of any content or products presented. Nothing on this website should be construed as legal, tax, investment, financial, medical, or other professional advice. In addition, no part of this site—including articles or product references—constitutes a solicitation, recommendation, endorsement, advertisement, or offer to buy or sell any securities, franchises, or other financial instruments, particularly in jurisdictions where such activity would be unlawful.
All content is of a general nature and may not address the specific circumstances of any individual or entity. It is not a substitute for professional advice or services. Any actions you take based on the information provided here are strictly at your own risk. You accept full responsibility for any decisions or outcomes arising from your use of this website and agree to release us from any liability in connection with your use of, or reliance upon, the content or products found herein.