
|
OVH Groupe S.A. (OVH.PA) DCF -Bewertung |
Fully Editable: Tailor To Your Needs In Excel Or Sheets
Professional Design: Trusted, Industry-Standard Templates
Investor-Approved Valuation Models
MAC/PC Compatible, Fully Unlocked
No Expertise Is Needed; Easy To Follow
OVH Groupe S.A. (OVH.PA) Bundle
Bewerten Sie die finanziellen Aussichten von OVH Groupe S.A. (OVHPA) wie ein Experte! Dieser (OVHPA) DCF-Taschenrechner liefert vorgefüllte Finanzdaten und ermöglicht Ihnen die Freiheit, das Umsatzwachstum, WACC, Margen und andere wichtige Annahmen zu ändern, um sich an Ihren Prognosen auszurichten.
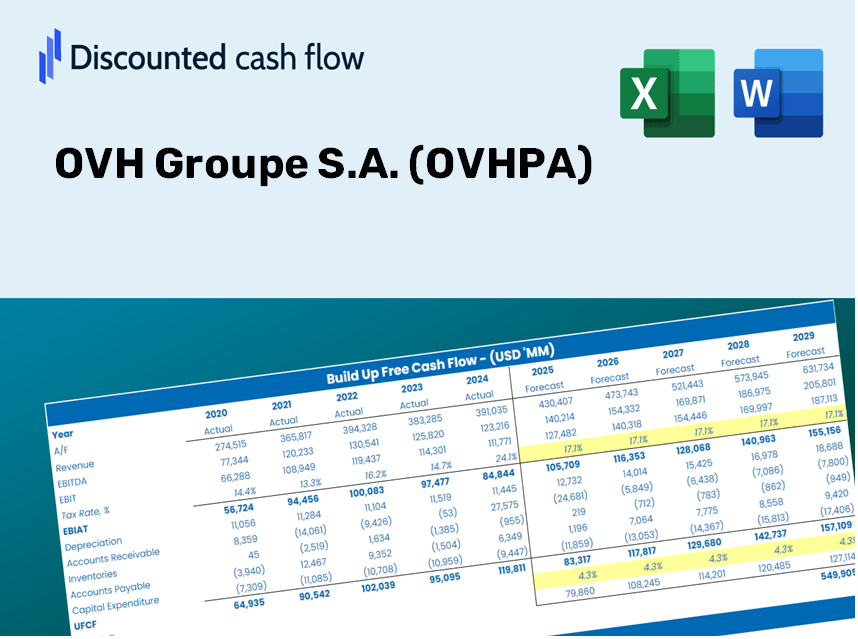
Discounted Cash Flow (DCF) - (USD MM)
| Year | AY1 2020 |
AY2 2021 |
AY3 2022 |
AY4 2023 |
AY5 2024 |
FY1 2025 |
FY2 2026 |
FY3 2027 |
FY4 2028 |
FY5 2029 |
|---|---|---|---|---|---|---|---|---|---|---|
| Revenue | 632.1 | 663.3 | 788.0 | 897.3 | 993.1 | 1,112.9 | 1,247.2 | 1,397.7 | 1,566.4 | 1,755.5 |
| Revenue Growth, % | 0 | 4.94 | 18.8 | 13.87 | 10.67 | 12.07 | 12.07 | 12.07 | 12.07 | 12.07 |
| EBITDA | 239.2 | 233.5 | 261.3 | 301.5 | 368.4 | 393.7 | 441.2 | 494.5 | 554.2 | 621.1 |
| EBITDA, % | 37.84 | 35.21 | 33.16 | 33.6 | 37.09 | 35.38 | 35.38 | 35.38 | 35.38 | 35.38 |
| Depreciation | 215.6 | 224.0 | 268.7 | 319.1 | 343.1 | 383.1 | 429.3 | 481.1 | 539.2 | 604.2 |
| Depreciation, % | 34.11 | 33.78 | 34.1 | 35.57 | 34.55 | 34.42 | 34.42 | 34.42 | 34.42 | 34.42 |
| EBIT | 23.6 | 9.5 | -7.4 | -17.7 | 25.3 | 10.7 | 12.0 | 13.4 | 15.0 | 16.8 |
| EBIT, % | 3.73 | 1.43 | -0.94366 | -1.97 | 2.55 | 0.95816 | 0.95816 | 0.95816 | 0.95816 | 0.95816 |
| Total Cash | 90.8 | 53.6 | 36.2 | 49.0 | 40.9 | 81.5 | 91.4 | 102.4 | 114.7 | 128.6 |
| Total Cash, percent | .0 | .0 | .0 | .0 | .0 | .0 | .0 | .0 | .0 | .0 |
| Account Receivables | 55.2 | 134.8 | 41.2 | 102.2 | 114.2 | 127.3 | 142.6 | 159.8 | 179.1 | 200.7 |
| Account Receivables, % | 8.73 | 20.32 | 5.23 | 11.39 | 11.5 | 11.44 | 11.44 | 11.44 | 11.44 | 11.44 |
| Inventories | .0 | .0 | 2.9 | .0 | 1.6 | 1.2 | 1.3 | 1.5 | 1.7 | 1.9 |
| Inventories, % | 0 | 0 | 0.37043 | 0 | 0.16031 | 0.10615 | 0.10615 | 0.10615 | 0.10615 | 0.10615 |
| Accounts Payable | 92.1 | 149.5 | 115.1 | 139.6 | 142.7 | 181.7 | 203.7 | 228.2 | 255.8 | 286.7 |
| Accounts Payable, % | 14.57 | 22.54 | 14.61 | 15.56 | 14.37 | 16.33 | 16.33 | 16.33 | 16.33 | 16.33 |
| Capital Expenditure | -280.3 | -343.2 | -453.4 | -357.8 | -343.1 | -507.6 | -568.9 | -637.5 | -714.5 | -800.7 |
| Capital Expenditure, % | -44.34 | -51.75 | -57.54 | -39.87 | -34.55 | -45.61 | -45.61 | -45.61 | -45.61 | -45.61 |
| Tax Rate, % | -61.04 | -61.04 | -61.04 | -61.04 | -61.04 | -61.04 | -61.04 | -61.04 | -61.04 | -61.04 |
| EBITAT | 475.0 | 13.9 | -10.7 | -17.7 | 40.8 | 10.7 | 11.9 | 13.4 | 15.0 | 16.8 |
| Depreciation | ||||||||||
| Changes in Account Receivables | ||||||||||
| Changes in Inventories | ||||||||||
| Changes in Accounts Payable | ||||||||||
| Capital Expenditure | ||||||||||
| UFCF | 447.2 | -127.5 | -139.2 | -90.0 | 30.3 | -87.5 | -121.2 | -135.8 | -152.2 | -170.6 |
| WACC, % | 8 | 8 | 8 | 7.99 | 8 | 8 | 8 | 8 | 8 | 8 |
| PV UFCF | ||||||||||
| SUM PV UFCF | -520.8 | |||||||||
| Long Term Growth Rate, % | 2.00 | |||||||||
| Free cash flow (T + 1) | -174 | |||||||||
| Terminal Value | -2,902 | |||||||||
| Present Terminal Value | -1,975 | |||||||||
| Enterprise Value | -2,496 | |||||||||
| Net Debt | 820 | |||||||||
| Equity Value | -3,317 | |||||||||
| Diluted Shares Outstanding, MM | 206 | |||||||||
| Equity Value Per Share | -16.11 |
What You Will Receive
- Customizable Excel Template: A fully adaptable Excel-based DCF Calculator featuring pre-filled financial data for OVH Groupe S.A. (OVHPA).
- Accurate Data: Access to historical performance data and future projections (highlighted in yellow cells).
- Adaptable Forecasting: Modify key assumptions such as revenue growth, EBITDA margins, and WACC.
- Instant Calculations: Quickly observe how your input changes influence the valuation of OVH Groupe S.A. (OVHPA).
- Professional Resource: Designed for investors, CFOs, consultants, and financial analysts.
- Intuitive Layout: Organized for easy comprehension and navigation, complete with detailed step-by-step guidance.
Key Features
- Current OVHPA Data: Pre-loaded with OVH Groupe S.A.’s historical financial performance and future growth estimates.
- Customizable Parameters: Modify factors such as revenue growth, profit margins, WACC, tax rates, and capital expenditures as needed.
- Interactive Valuation Model: Automatically recalculates Net Present Value (NPV) and intrinsic value based on your adjustments.
- Scenario Analysis: Develop various forecasting scenarios to evaluate a range of valuation results.
- User-Centric Interface: Intuitive design, organized for both experienced professionals and newcomers.
How It Functions
- Download the Template: Gain immediate access to the Excel-based OVH DCF Calculator for OVH Groupe S.A. (OVHPA).
- Enter Your Assumptions: Modify the yellow-highlighted cells for growth rates, WACC, margins, and other parameters.
- Real-Time Calculations: The model will automatically refresh to reflect OVH's intrinsic value.
- Test Scenarios: Experiment with various assumptions to assess potential changes in valuation.
- Analyze and Decide: Utilize the outcomes to inform your investment or financial analysis.
Why Choose This Calculator for OVH Groupe S.A. (OVHPA)?
- Designed for Professionals: A sophisticated tool favored by analysts, CFOs, and consultants.
- Accurate Data: OVH Groupe S.A.’s historical and projected financials are preloaded for precision.
- Scenario Analysis: Effortlessly test various forecasts and assumptions.
- Comprehensive Results: Instantly calculates intrinsic value, NPV, and essential metrics.
- User-Friendly: Step-by-step guidance ensures a smooth experience.
Who Can Benefit from OVH Groupe S.A. (OVHPA)?
- Professional Investors: Develop comprehensive and trustworthy valuation models for assessing investments.
- Corporate Finance Teams: Evaluate different valuation scenarios to inform strategic decisions within the organization.
- Consultants and Advisors: Deliver precise valuation insights specific to OVH Groupe S.A. (OVHPA) for client advisement.
- Students and Educators: Utilize real-world data to enhance learning and application of financial modeling concepts.
- Tech Enthusiasts: Gain insights into how technology firms like OVH Groupe S.A. (OVHPA) are assessed in the financial markets.
Contents of the Template
- Pre-Filled Data: Contains OVH Groupe S.A.'s historical financial performance and projections.
- Discounted Cash Flow Model: An editable DCF valuation model featuring automatic calculations.
- Weighted Average Cost of Capital (WACC): A specialized sheet for calculating WACC using customizable inputs.
- Key Financial Ratios: Evaluate OVH Groupe S.A.’s (OVHPA) profitability, efficiency, and leverage metrics.
- Customizable Inputs: Easily modify revenue growth rates, profit margins, and tax rates.
- Intuitive Dashboard: Visual representations in charts and tables summarizing essential valuation outcomes.
Disclaimer
All information, articles, and product details provided on this website are for general informational and educational purposes only. We do not claim any ownership over, nor do we intend to infringe upon, any trademarks, copyrights, logos, brand names, or other intellectual property mentioned or depicted on this site. Such intellectual property remains the property of its respective owners, and any references here are made solely for identification or informational purposes, without implying any affiliation, endorsement, or partnership.
We make no representations or warranties, express or implied, regarding the accuracy, completeness, or suitability of any content or products presented. Nothing on this website should be construed as legal, tax, investment, financial, medical, or other professional advice. In addition, no part of this site—including articles or product references—constitutes a solicitation, recommendation, endorsement, advertisement, or offer to buy or sell any securities, franchises, or other financial instruments, particularly in jurisdictions where such activity would be unlawful.
All content is of a general nature and may not address the specific circumstances of any individual or entity. It is not a substitute for professional advice or services. Any actions you take based on the information provided here are strictly at your own risk. You accept full responsibility for any decisions or outcomes arising from your use of this website and agree to release us from any liability in connection with your use of, or reliance upon, the content or products found herein.