
|
Pan African Resources PLC (PAF.L) DCF -Bewertung |
Fully Editable: Tailor To Your Needs In Excel Or Sheets
Professional Design: Trusted, Industry-Standard Templates
Investor-Approved Valuation Models
MAC/PC Compatible, Fully Unlocked
No Expertise Is Needed; Easy To Follow
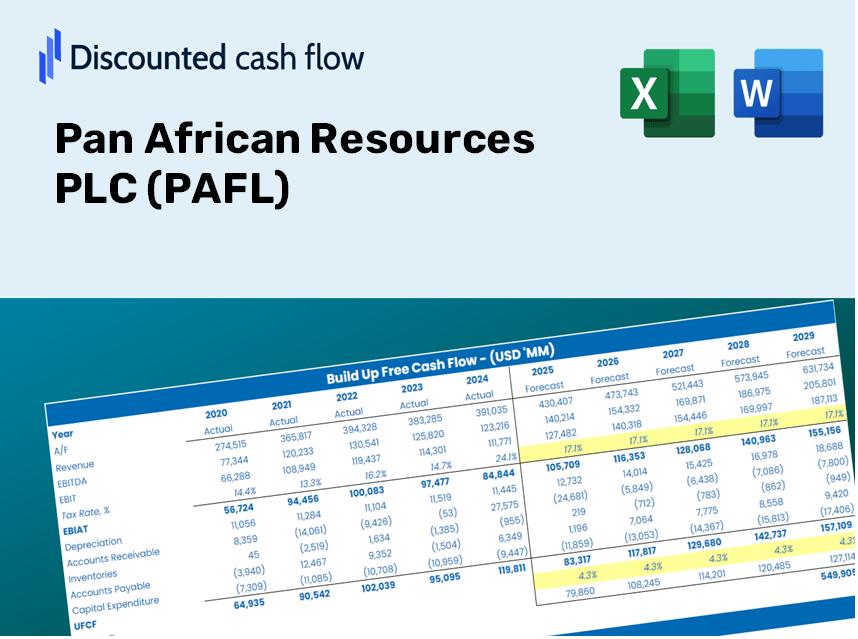
Pan African Resources PLC (PAF.L) Bundle
Egal, ob Sie ein Investor oder Analyst sind, dieser Pan African Resources Plc (PAFL) DCF-Taschenrechner ist Ihre Anlaufstelle für eine genaue Bewertung. Mit realen Daten aus Pan African Resources geladen, können Sie Prognosen anpassen und die Auswirkungen in Echtzeit beobachten.
Discounted Cash Flow (DCF) - (USD MM)
| Year | AY1 2021 |
AY2 2022 |
AY3 2023 |
AY4 2024 |
AY5 2025 |
FY1 2026 |
FY2 2027 |
FY3 2028 |
FY4 2029 |
FY5 2030 |
|---|---|---|---|---|---|---|---|---|---|---|
| Revenue | 280.6 | 286.3 | 244.6 | 284.3 | 410.7 | 460.2 | 515.6 | 577.7 | 647.3 | 725.2 |
| Revenue Growth, % | 0 | 2.02 | -14.55 | 16.23 | 44.47 | 12.04 | 12.04 | 12.04 | 12.04 | 12.04 |
| EBITDA | 110.2 | 80.0 | 87.6 | 108.8 | 191.6 | 173.0 | 193.8 | 217.2 | 243.3 | 272.6 |
| EBITDA, % | 39.28 | 27.96 | 35.81 | 38.26 | 46.65 | 37.59 | 37.59 | 37.59 | 37.59 | 37.59 |
| Depreciation | 18.9 | 16.4 | 14.0 | 16.7 | 26.2 | 28.0 | 31.3 | 35.1 | 39.4 | 44.1 |
| Depreciation, % | 6.73 | 5.71 | 5.73 | 5.86 | 6.37 | 6.08 | 6.08 | 6.08 | 6.08 | 6.08 |
| EBIT | 91.3 | 63.7 | 73.6 | 92.1 | 165.4 | 145.0 | 162.5 | 182.0 | 204.0 | 228.5 |
| EBIT, % | 32.55 | 22.25 | 30.08 | 32.4 | 40.28 | 31.51 | 31.51 | 31.51 | 31.51 | 31.51 |
| Total Cash | 26.7 | 20.5 | 26.4 | 20.0 | 37.7 | 40.2 | 45.1 | 50.5 | 56.6 | 63.4 |
| Total Cash, percent | .0 | .0 | .0 | .0 | .0 | .0 | .0 | .0 | .0 | .0 |
| Account Receivables | 19.7 | 10.7 | 1.8 | 3.0 | .0 | 11.6 | 13.0 | 14.5 | 16.3 | 18.2 |
| Account Receivables, % | 7.01 | 3.75 | 0.7276 | 1.07 | 0 | 2.51 | 2.51 | 2.51 | 2.51 | 2.51 |
| Inventories | 8.6 | 7.6 | 7.3 | 12.5 | 29.6 | 18.7 | 20.9 | 23.5 | 26.3 | 29.4 |
| Inventories, % | 3.08 | 2.65 | 2.97 | 4.4 | 7.2 | 4.06 | 4.06 | 4.06 | 4.06 | 4.06 |
| Accounts Payable | 22.5 | 22.8 | 27.7 | 34.1 | 33.5 | 43.7 | 48.9 | 54.8 | 61.4 | 68.8 |
| Accounts Payable, % | 8.03 | 7.97 | 11.31 | 11.98 | 8.15 | 9.49 | 9.49 | 9.49 | 9.49 | 9.49 |
| Capital Expenditure | -33.8 | -62.9 | -85.8 | -126.6 | -120.6 | -131.6 | -147.4 | -165.2 | -185.1 | -207.4 |
| Capital Expenditure, % | -12.05 | -21.97 | -35.08 | -44.51 | -29.37 | -28.6 | -28.6 | -28.6 | -28.6 | -28.6 |
| Tax Rate, % | 27.99 | 27.99 | 27.99 | 27.99 | 27.99 | 27.99 | 27.99 | 27.99 | 27.99 | 27.99 |
| EBITAT | 65.1 | 44.8 | 52.6 | 66.8 | 119.1 | 103.7 | 116.2 | 130.2 | 145.9 | 163.4 |
| Depreciation | ||||||||||
| Changes in Account Receivables | ||||||||||
| Changes in Inventories | ||||||||||
| Changes in Accounts Payable | ||||||||||
| Capital Expenditure | ||||||||||
| UFCF | 44.4 | 8.5 | -5.1 | -43.2 | 10.0 | 9.6 | 1.7 | 1.9 | 2.1 | 2.4 |
| WACC, % | 7.12 | 7.05 | 7.13 | 7.2 | 7.17 | 7.13 | 7.13 | 7.13 | 7.13 | 7.13 |
| PV UFCF | ||||||||||
| SUM PV UFCF | 15.3 | |||||||||
| Long Term Growth Rate, % | 0.50 | |||||||||
| Free cash flow (T + 1) | 2 | |||||||||
| Terminal Value | 36 | |||||||||
| Present Terminal Value | 26 | |||||||||
| Enterprise Value | 41 | |||||||||
| Net Debt | 110 | |||||||||
| Equity Value | -68 | |||||||||
| Diluted Shares Outstanding, MM | 96 | |||||||||
| Equity Value Per Share | -70.99 |
What You Will Receive
- Authentic Pan African Data: Comprehensive financials preloaded – encompassing everything from revenue to EBIT – grounded in actual and projected data.
- Complete Customization: Modify all essential parameters (yellow cells) such as WACC, growth %, and tax rates to fit your analysis.
- Real-Time Valuation Adjustments: Automatic recalculations that allow you to assess the effects of any changes on the fair value of Pan African Resources PLC (PAFL).
- Flexible Excel Template: Designed for easy modifications, scenario analysis, and in-depth forecasting.
- Efficient and Precise: Eliminate the need to build models from the ground up while ensuring accuracy and adaptability.
Key Features
- 🔍 Real-Life PAFL Financials: Pre-filled historical and projected data for Pan African Resources PLC (PAFL).
- ✏️ Fully Customizable Inputs: Tailor all essential parameters (yellow cells) including WACC, growth %, and tax rates.
- 📊 Professional DCF Valuation: Integrated formulas compute the intrinsic value of Pan African Resources PLC (PAFL) using the Discounted Cash Flow method.
- ⚡ Instant Results: Quickly visualize the valuation of Pan African Resources PLC (PAFL) right after adjustments are made.
- Scenario Analysis: Evaluate and compare results for different financial assumptions side-by-side.
How It Functions
- 1. Access the Template: Download and open the Excel file containing Pan African Resources PLC’s (PAFL) preloaded data.
- 2. Customize Assumptions: Adjust key parameters such as growth rates, WACC, and capital expenditures as needed.
- 3. See Results Immediately: The DCF model automatically computes intrinsic value and NPV in real-time.
- 4. Explore Various Scenarios: Analyze multiple forecasts to evaluate different valuation scenarios.
- 5. Present with Assurance: Share professional valuation insights to bolster your decision-making process.
Why Opt for This Calculator?
- Reliable Data: Up-to-date financials for Pan African Resources PLC (PAFL) guarantee trustworthy valuation results.
- Tailorable: Modify essential parameters such as growth rates, WACC, and tax rates to fit your financial forecasts.
- Efficiency Boost: Ready-made calculations save you the hassle of starting from the ground up.
- Expert-Quality Tool: Crafted for investors, analysts, and consultants alike.
- Easy to Use: A straightforward design with clear, step-by-step guidance ensures accessibility for all users.
Who Can Benefit from This Product?
- Finance Students: Master valuation techniques and practice using real-world data.
- Academics: Integrate industry-standard models into your research or teaching materials.
- Investors: Validate your investment hypotheses and evaluate valuation results for Pan African Resources PLC (PAFL).
- Analysts: Enhance your efficiency with a customizable, ready-to-use DCF model.
- Small Business Owners: Understand the analytical approaches used for large public enterprises like Pan African Resources PLC (PAFL).
What This Template Includes
- Preloaded PAFL Data: Historical and projected financial information, encompassing revenue, EBIT, and capital expenditures.
- DCF and WACC Models: Professional-quality sheets designed for calculating intrinsic value and Weighted Average Cost of Capital.
- Editable Inputs: Yellow-highlighted cells allowing adjustments for revenue growth, tax rates, and discount rates.
- Financial Statements: Detailed annual and quarterly financial reports for in-depth analysis.
- Key Ratios: Ratios related to profitability, leverage, and efficiency for performance assessment.
- Dashboard and Charts: Visual representations of valuation results and underlying assumptions.
Disclaimer
All information, articles, and product details provided on this website are for general informational and educational purposes only. We do not claim any ownership over, nor do we intend to infringe upon, any trademarks, copyrights, logos, brand names, or other intellectual property mentioned or depicted on this site. Such intellectual property remains the property of its respective owners, and any references here are made solely for identification or informational purposes, without implying any affiliation, endorsement, or partnership.
We make no representations or warranties, express or implied, regarding the accuracy, completeness, or suitability of any content or products presented. Nothing on this website should be construed as legal, tax, investment, financial, medical, or other professional advice. In addition, no part of this site—including articles or product references—constitutes a solicitation, recommendation, endorsement, advertisement, or offer to buy or sell any securities, franchises, or other financial instruments, particularly in jurisdictions where such activity would be unlawful.
All content is of a general nature and may not address the specific circumstances of any individual or entity. It is not a substitute for professional advice or services. Any actions you take based on the information provided here are strictly at your own risk. You accept full responsibility for any decisions or outcomes arising from your use of this website and agree to release us from any liability in connection with your use of, or reliance upon, the content or products found herein.