
|
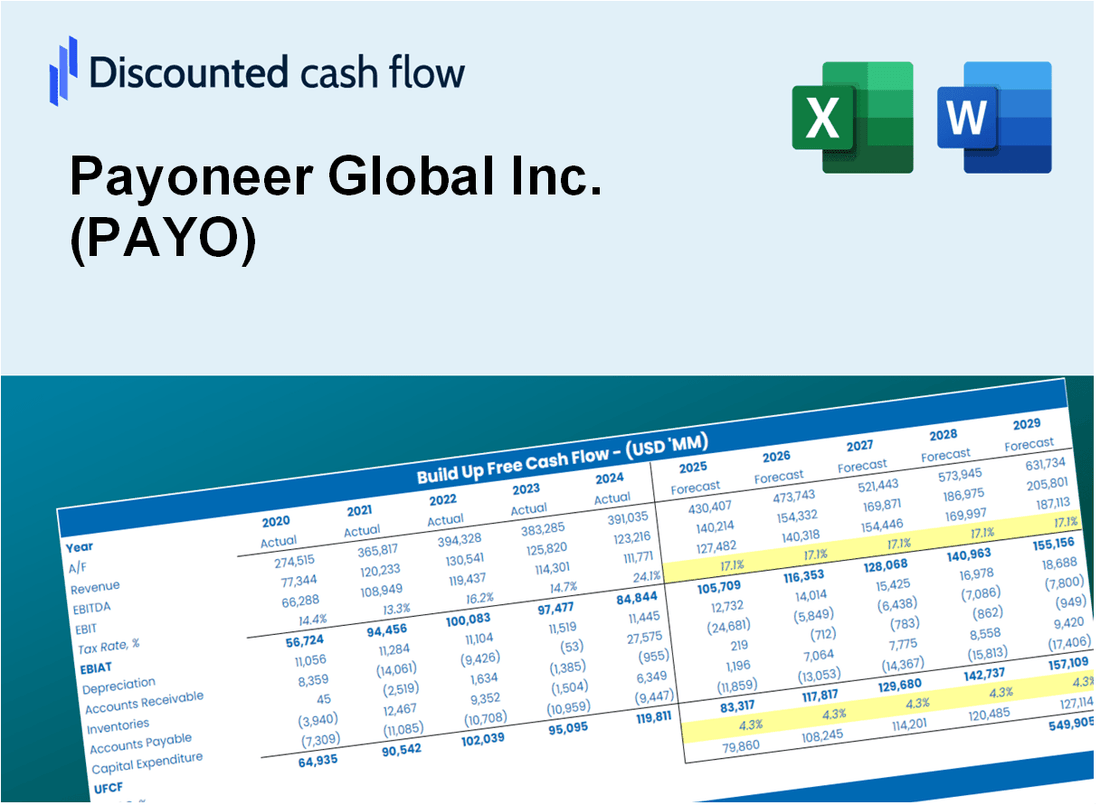
Payoneer Global Inc. (PAYO) DCF -Bewertung |
Fully Editable: Tailor To Your Needs In Excel Or Sheets
Professional Design: Trusted, Industry-Standard Templates
Investor-Approved Valuation Models
MAC/PC Compatible, Fully Unlocked
No Expertise Is Needed; Easy To Follow
Payoneer Global Inc. (PAYO) Bundle
Verbessern Sie Ihre Anlagestrategie mit dem DCF -Taschenrechner von Payoneer Global Inc. (PAYO)! Erhalten Sie echte Payoneer -Finanzdaten, passen Sie Wachstumsprognosen und -kosten an und beachten Sie sofort, wie sich diese Änderungen auf den inneren Wert von Payoneer Global Inc. (PAYO) auswirken.
Discounted Cash Flow (DCF) - (USD MM)
| Year | AY1 2020 |
AY2 2021 |
AY3 2022 |
AY4 2023 |
AY5 2024 |
FY1 2025 |
FY2 2026 |
FY3 2027 |
FY4 2028 |
FY5 2029 |
|---|---|---|---|---|---|---|---|---|---|---|
| Revenue | 345.6 | 473.4 | 627.6 | 831.1 | 977.7 | 1,270.1 | 1,649.9 | 2,143.4 | 2,784.3 | 3,617.0 |
| Revenue Growth, % | 0 | 36.98 | 32.58 | 32.42 | 17.64 | 29.91 | 29.91 | 29.91 | 29.91 | 29.91 |
| EBITDA | 1.2 | -7.1 | -8.2 | 131.4 | 196.3 | 84.9 | 110.3 | 143.3 | 186.1 | 241.8 |
| EBITDA, % | 0.34636 | -1.51 | -1.31 | 15.81 | 20.08 | 6.68 | 6.68 | 6.68 | 6.68 | 6.68 |
| Depreciation | 16.5 | 17.9 | 20.2 | 27.8 | 45.4 | 50.2 | 65.2 | 84.7 | 110.1 | 143.0 |
| Depreciation, % | 4.77 | 3.78 | 3.23 | 3.35 | 4.65 | 3.95 | 3.95 | 3.95 | 3.95 | 3.95 |
| EBIT | -15.3 | -25.0 | -28.5 | 103.6 | 150.9 | 34.7 | 45.1 | 58.5 | 76.0 | 98.8 |
| EBIT, % | -4.42 | -5.28 | -4.54 | 12.47 | 15.43 | 2.73 | 2.73 | 2.73 | 2.73 | 2.73 |
| Total Cash | 103.0 | 465.9 | 543.3 | 617.0 | 497.5 | 863.4 | 1,121.7 | 1,457.1 | 1,892.8 | 2,458.9 |
| Total Cash, percent | .0 | .0 | .0 | .0 | .0 | .0 | .0 | .0 | .0 | .0 |
| Account Receivables | 84.0 | 77.3 | 61.2 | 66.3 | 92.8 | 172.4 | 224.0 | 291.0 | 378.0 | 491.0 |
| Account Receivables, % | 24.32 | 16.34 | 9.75 | 7.98 | 9.49 | 13.58 | 13.58 | 13.58 | 13.58 | 13.58 |
| Inventories | 3,381.2 | 4,404.3 | 5,841.5 | 7.0 | .0 | 764.2 | 992.8 | 1,289.6 | 1,675.3 | 2,176.3 |
| Inventories, % | 978.38 | 930.34 | 930.73 | 0.84586 | 0 | 60.17 | 60.17 | 60.17 | 60.17 | 60.17 |
| Accounts Payable | 17.2 | 17.2 | 41.6 | 33.9 | 37.3 | 58.8 | 76.4 | 99.2 | 128.9 | 167.4 |
| Accounts Payable, % | 4.99 | 3.63 | 6.62 | 4.08 | 3.82 | 4.63 | 4.63 | 4.63 | 4.63 | 4.63 |
| Capital Expenditure | -14.0 | -20.9 | -28.8 | -47.8 | -8.2 | -49.9 | -64.9 | -84.3 | -109.5 | -142.2 |
| Capital Expenditure, % | -4.06 | -4.41 | -4.59 | -5.75 | -0.83756 | -3.93 | -3.93 | -3.93 | -3.93 | -3.93 |
| Tax Rate, % | 13.13 | 13.13 | 13.13 | 13.13 | 13.13 | 13.13 | 13.13 | 13.13 | 13.13 | 13.13 |
| EBITAT | -23.6 | -33.7 | 210.6 | 73.0 | 131.1 | 24.8 | 32.2 | 41.8 | 54.3 | 70.6 |
| Depreciation | ||||||||||
| Changes in Account Receivables | ||||||||||
| Changes in Inventories | ||||||||||
| Changes in Accounts Payable | ||||||||||
| Capital Expenditure | ||||||||||
| UFCF | -3,469.1 | -1,053.1 | -1,194.7 | 5,874.7 | 152.2 | -797.3 | -230.0 | -298.7 | -388.1 | -504.1 |
| WACC, % | 8.15 | 8.15 | 8.12 | 8.14 | 8.15 | 8.14 | 8.14 | 8.14 | 8.14 | 8.14 |
| PV UFCF | ||||||||||
| SUM PV UFCF | -1,794.7 | |||||||||
| Long Term Growth Rate, % | 2.00 | |||||||||
| Free cash flow (T + 1) | -514 | |||||||||
| Terminal Value | -8,373 | |||||||||
| Present Terminal Value | -5,661 | |||||||||
| Enterprise Value | -7,456 | |||||||||
| Net Debt | -476 | |||||||||
| Equity Value | -6,980 | |||||||||
| Diluted Shares Outstanding, MM | 386 | |||||||||
| Equity Value Per Share | -18.07 |
What You Will Receive
- Comprehensive Financial Model: Payoneer’s actual performance data facilitates accurate DCF valuation.
- Complete Forecasting Control: Modify revenue growth, profit margins, WACC, and other essential variables.
- Real-Time Calculations: Instantaneous updates guarantee you see outcomes as you adjust inputs.
- Professional-Grade Template: An advanced Excel file crafted for high-quality valuation presentations.
- Flexible and Reusable: Designed for adaptability, allowing for repeated application in detailed financial forecasting.
Key Features
- Comprehensive Financial Data: Access Payoneer Global Inc.'s historical financial statements and projected forecasts.
- Customizable Parameters: Modify WACC, tax rates, revenue growth, and EBITDA margins to fit your analysis.
- Real-Time Valuation: Instantly view the recalculated intrinsic value of Payoneer Global Inc. (PAYO).
- Intuitive Visualizations: Dashboard graphs present valuation outcomes and essential metrics clearly.
- Designed for Precision: A reliable tool tailored for analysts, investors, and finance professionals.
How It Works
- Step 1: Download the prebuilt Excel template featuring Payoneer Global Inc. (PAYO) data.
- Step 2: Navigate through the pre-filled sheets to familiarize yourself with the essential metrics.
- Step 3: Adjust forecasts and assumptions in the editable yellow cells (WACC, growth, margins).
- Step 4: Instantly see the updated results, including Payoneer Global Inc.’s (PAYO) intrinsic value.
- Step 5: Make well-informed investment decisions or create reports based on the outputs.
Why Choose This Calculator for Payoneer Global Inc. (PAYO)?
- Accurate Data: Utilize real Payoneer financials for trustworthy valuation outcomes.
- Customizable: Tailor essential parameters such as growth rates, WACC, and tax rates to align with your forecasts.
- Time-Saving: Built-in calculations save you the effort of starting from the ground up.
- Professional-Grade Tool: Crafted for investors, analysts, and financial consultants.
- User-Friendly: Easy-to-navigate design and clear instructions ensure accessibility for all users.
Who Should Use This Product?
- Investors: Evaluate Payoneer Global Inc.'s (PAYO) performance before making investment decisions.
- CFOs and Financial Analysts: Optimize financial assessments and validate revenue forecasts.
- Startup Founders: Understand the valuation methods applied to fintech companies like Payoneer.
- Consultants: Provide detailed valuation analyses and reports for clients in the financial sector.
- Students and Educators: Utilize current market data to learn and teach valuation strategies.
What the Template Contains
- Pre-Filled DCF Model: Payoneer Global Inc.'s (PAYO) financial data preloaded for immediate use.
- WACC Calculator: Detailed calculations for Weighted Average Cost of Capital specific to Payoneer.
- Financial Ratios: Evaluate Payoneer's profitability, leverage, and efficiency metrics.
- Editable Inputs: Change assumptions such as growth rates, margins, and CAPEX to tailor your analysis.
- Financial Statements: Access annual and quarterly reports for comprehensive analysis of Payoneer.
- Interactive Dashboard: Easily visualize key valuation metrics and outcomes for Payoneer Global Inc. (PAYO).
Disclaimer
All information, articles, and product details provided on this website are for general informational and educational purposes only. We do not claim any ownership over, nor do we intend to infringe upon, any trademarks, copyrights, logos, brand names, or other intellectual property mentioned or depicted on this site. Such intellectual property remains the property of its respective owners, and any references here are made solely for identification or informational purposes, without implying any affiliation, endorsement, or partnership.
We make no representations or warranties, express or implied, regarding the accuracy, completeness, or suitability of any content or products presented. Nothing on this website should be construed as legal, tax, investment, financial, medical, or other professional advice. In addition, no part of this site—including articles or product references—constitutes a solicitation, recommendation, endorsement, advertisement, or offer to buy or sell any securities, franchises, or other financial instruments, particularly in jurisdictions where such activity would be unlawful.
All content is of a general nature and may not address the specific circumstances of any individual or entity. It is not a substitute for professional advice or services. Any actions you take based on the information provided here are strictly at your own risk. You accept full responsibility for any decisions or outcomes arising from your use of this website and agree to release us from any liability in connection with your use of, or reliance upon, the content or products found herein.