
|
Premier Foods Plc (PFD.L) DCF -Bewertung |
Fully Editable: Tailor To Your Needs In Excel Or Sheets
Professional Design: Trusted, Industry-Standard Templates
Investor-Approved Valuation Models
MAC/PC Compatible, Fully Unlocked
No Expertise Is Needed; Easy To Follow
Premier Foods plc (PFD.L) Bundle
Bewerten Sie die Finanzaussichten für die Premier Foods PLC (PFDL) wie ein Experte! Dieser (PFDL) DCF-Taschenrechner bietet vorgefüllte Finanzdaten sowie vollständige Flexibilität, um das Umsatzwachstum, WACC, Margen und andere wesentliche Annahmen zu ändern, um sich mit Ihren Prognosen anzupassen.
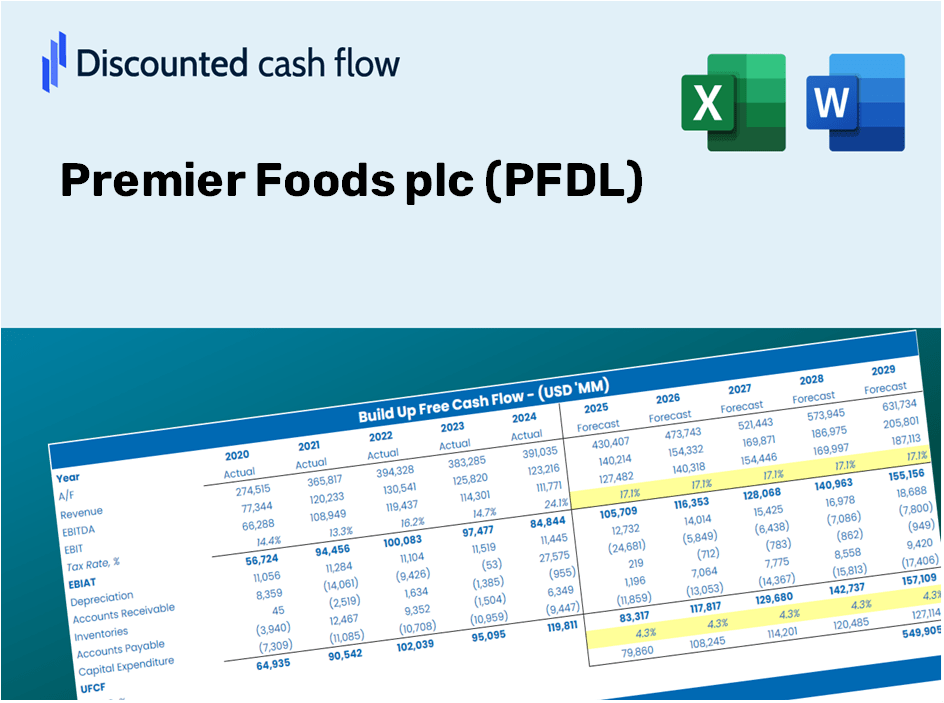
Discounted Cash Flow (DCF) - (USD MM)
| Year | AY1 2021 |
AY2 2022 |
AY3 2023 |
AY4 2024 |
AY5 2025 |
FY1 2026 |
FY2 2027 |
FY3 2028 |
FY4 2029 |
FY5 2030 |
|---|---|---|---|---|---|---|---|---|---|---|
| Revenue | 947.0 | 900.5 | 1,006.4 | 1,137.5 | 1,149.0 | 1,209.0 | 1,272.1 | 1,338.6 | 1,408.5 | 1,482.0 |
| Revenue Growth, % | 0 | -4.91 | 11.76 | 13.03 | 1.01 | 5.22 | 5.22 | 5.22 | 5.22 | 5.22 |
| EBITDA | 208.3 | 169.7 | 177.7 | 225.3 | 232.1 | 238.2 | 250.6 | 263.7 | 277.5 | 292.0 |
| EBITDA, % | 22 | 18.85 | 17.66 | 19.81 | 20.2 | 19.7 | 19.7 | 19.7 | 19.7 | 19.7 |
| Depreciation | 49.5 | 46.2 | 45.5 | 45.3 | 45.9 | 55.3 | 58.2 | 61.2 | 64.4 | 67.7 |
| Depreciation, % | 5.23 | 5.13 | 4.52 | 3.98 | 3.99 | 4.57 | 4.57 | 4.57 | 4.57 | 4.57 |
| EBIT | 158.8 | 123.5 | 132.2 | 180.0 | 186.2 | 182.9 | 192.5 | 202.5 | 213.1 | 224.2 |
| EBIT, % | 16.77 | 13.71 | 13.14 | 15.82 | 16.21 | 15.13 | 15.13 | 15.13 | 15.13 | 15.13 |
| Total Cash | 4.2 | 54.3 | 64.4 | 102.3 | 191.5 | 93.2 | 98.0 | 103.2 | 108.5 | 114.2 |
| Total Cash, percent | .0 | .0 | .0 | .0 | .0 | .0 | .0 | .0 | .0 | .0 |
| Account Receivables | 51.9 | 69.0 | 84.9 | 84.2 | 78.8 | 86.7 | 91.2 | 95.9 | 101.0 | 106.2 |
| Account Receivables, % | 5.48 | 7.66 | 8.44 | 7.4 | 6.86 | 7.17 | 7.17 | 7.17 | 7.17 | 7.17 |
| Inventories | 68.8 | 78.1 | 93.7 | 98.9 | 101.5 | 103.4 | 108.8 | 114.5 | 120.5 | 126.8 |
| Inventories, % | 7.27 | 8.67 | 9.31 | 8.69 | 8.83 | 8.56 | 8.56 | 8.56 | 8.56 | 8.56 |
| Accounts Payable | 126.1 | 137.4 | 141.1 | 141.6 | 140.5 | 162.7 | 171.2 | 180.1 | 189.5 | 199.4 |
| Accounts Payable, % | 13.32 | 15.26 | 14.02 | 12.45 | 12.23 | 13.45 | 13.45 | 13.45 | 13.45 | 13.45 |
| Capital Expenditure | -23.6 | -23.2 | -20.0 | -32.8 | -41.4 | -32.7 | -34.5 | -36.3 | -38.1 | -40.1 |
| Capital Expenditure, % | -2.49 | -2.58 | -1.99 | -2.88 | -3.6 | -2.71 | -2.71 | -2.71 | -2.71 | -2.71 |
| Tax Rate, % | 22.57 | 22.57 | 22.57 | 22.57 | 22.57 | 22.57 | 22.57 | 22.57 | 22.57 | 22.57 |
| EBITAT | 137.1 | 93.3 | 107.7 | 133.8 | 144.2 | 144.5 | 152.1 | 160.0 | 168.4 | 177.2 |
| Depreciation | ||||||||||
| Changes in Account Receivables | ||||||||||
| Changes in Inventories | ||||||||||
| Changes in Accounts Payable | ||||||||||
| Capital Expenditure | ||||||||||
| UFCF | 168.4 | 101.2 | 105.4 | 142.3 | 150.4 | 179.4 | 174.3 | 183.5 | 193.0 | 203.1 |
| WACC, % | 6.64 | 6.5 | 6.58 | 6.48 | 6.52 | 6.54 | 6.54 | 6.54 | 6.54 | 6.54 |
| PV UFCF | ||||||||||
| SUM PV UFCF | 771.4 | |||||||||
| Long Term Growth Rate, % | 1.00 | |||||||||
| Free cash flow (T + 1) | 205 | |||||||||
| Terminal Value | 3,700 | |||||||||
| Present Terminal Value | 2,695 | |||||||||
| Enterprise Value | 3,466 | |||||||||
| Net Debt | 144 | |||||||||
| Equity Value | 3,323 | |||||||||
| Diluted Shares Outstanding, MM | 885 | |||||||||
| Equity Value Per Share | 375.38 |
What You Will Receive
- Genuine Premier Foods Data: Preloaded financials – from revenue to EBIT – based on authentic and projected figures.
- Complete Customization: Modify all key parameters (yellow cells) such as WACC, growth %, and tax rates.
- Instant Valuation Updates: Automated recalculations to assess the effects of changes on Premier Foods' fair value.
- Flexible Excel Template: Designed for easy edits, scenario analysis, and comprehensive forecasting.
- Efficient and Precise: Eliminate the need to build models from scratch while ensuring accuracy and adaptability.
Key Features
- Customizable Forecast Inputs: Adjust essential parameters such as revenue growth, EBITDA percentage, and capital expenditures.
- Instant DCF Valuation: Quickly computes intrinsic value, NPV, and other critical financial metrics.
- High-Precision Accuracy: Leverages Premier Foods plc's (PFDL) actual financial data for credible valuation results.
- Streamlined Scenario Analysis: Easily explore various assumptions and assess corresponding outcomes.
- Efficiency Booster: Avoid the hassle of creating complex valuation models from the ground up.
How It Works
- Step 1: Download the prebuilt Excel template featuring Premier Foods plc (PFDL) data.
- Step 2: Review the pre-filled sheets to familiarize yourself with the essential metrics.
- Step 3: Modify forecasts and assumptions in the editable yellow cells (WACC, growth, margins).
- Step 4: Instantly view the updated results, including Premier Foods plc (PFDL)'s intrinsic value.
- Step 5: Use the outputs to make informed investment choices or create detailed reports.
Why Opt for This Calculator?
- All-in-One Solution: Features DCF, WACC, and financial ratio analyses seamlessly integrated.
- Adjustable Parameters: Modify the highlighted cells to explore different scenarios.
- In-Depth Analysis: Automatically computes Premier Foods plc's intrinsic value and Net Present Value.
- Included Data: Historical and projected information provides reliable starting points.
- High-Quality Standards: Perfect for financial analysts, investors, and business advisors.
Who Can Benefit from Premier Foods plc (PFDL)?
- Investors: Make informed investment choices with a top-tier valuation tool.
- Financial Analysts: Streamline your workflow using a customizable DCF model readily available.
- Consultants: Effortlessly modify the template for impactful client presentations and reports.
- Finance Enthusiasts: Enhance your knowledge of valuation methods with real-life case studies.
- Educators and Students: Utilize this resource as a practical aid in finance-related academic programs.
What the Template Includes
- Extensive DCF Model: Fully editable template featuring in-depth valuation calculations.
- Real-Time Data: Premier Foods plc's (PFDL) historical and forecasted financials preloaded for thorough analysis.
- Adjustable Parameters: Modify WACC, growth rates, and tax assumptions to explore various scenarios.
- Financial Statements: Comprehensive annual and quarterly breakdowns for enhanced insights.
- Key Ratios: Integrated analysis for assessing profitability, efficiency, and leverage.
- Interactive Dashboard with Visual Outputs: Charts and tables designed for clear, actionable insights.
Disclaimer
All information, articles, and product details provided on this website are for general informational and educational purposes only. We do not claim any ownership over, nor do we intend to infringe upon, any trademarks, copyrights, logos, brand names, or other intellectual property mentioned or depicted on this site. Such intellectual property remains the property of its respective owners, and any references here are made solely for identification or informational purposes, without implying any affiliation, endorsement, or partnership.
We make no representations or warranties, express or implied, regarding the accuracy, completeness, or suitability of any content or products presented. Nothing on this website should be construed as legal, tax, investment, financial, medical, or other professional advice. In addition, no part of this site—including articles or product references—constitutes a solicitation, recommendation, endorsement, advertisement, or offer to buy or sell any securities, franchises, or other financial instruments, particularly in jurisdictions where such activity would be unlawful.
All content is of a general nature and may not address the specific circumstances of any individual or entity. It is not a substitute for professional advice or services. Any actions you take based on the information provided here are strictly at your own risk. You accept full responsibility for any decisions or outcomes arising from your use of this website and agree to release us from any liability in connection with your use of, or reliance upon, the content or products found herein.