
|
Die Progressive Corporation (PGR) DCF -Bewertung |
Fully Editable: Tailor To Your Needs In Excel Or Sheets
Professional Design: Trusted, Industry-Standard Templates
Investor-Approved Valuation Models
MAC/PC Compatible, Fully Unlocked
No Expertise Is Needed; Easy To Follow
The Progressive Corporation (PGR) Bundle
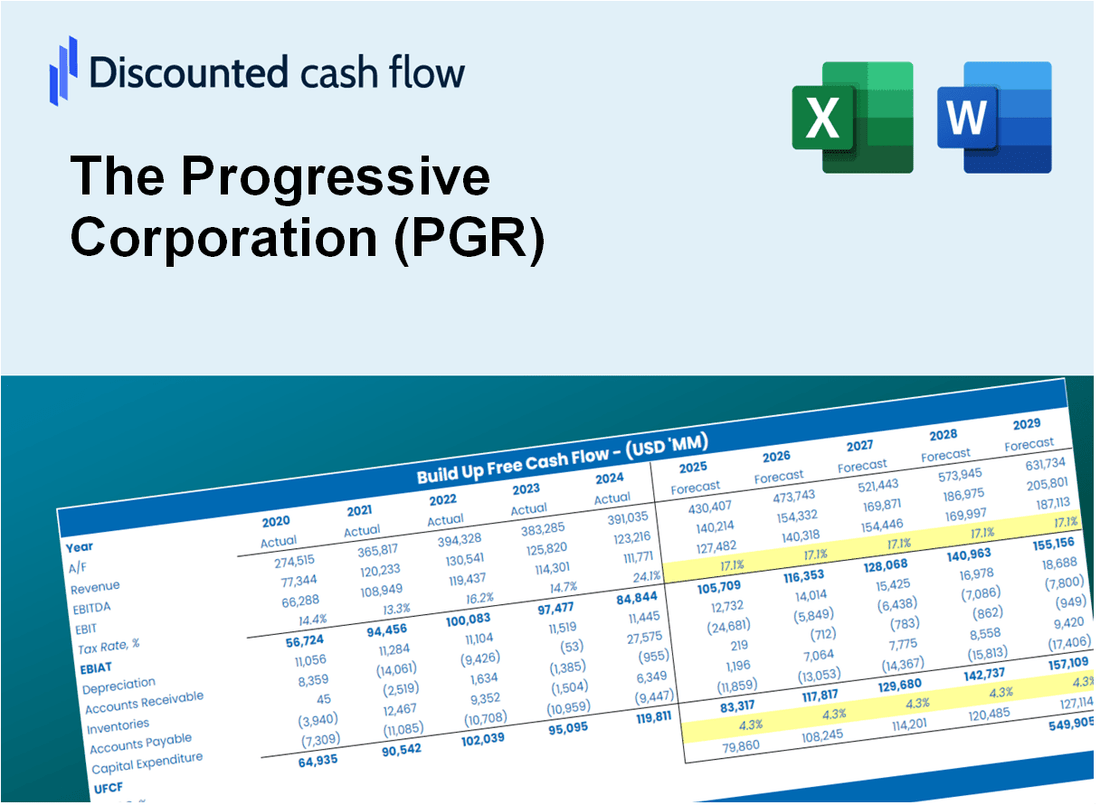
Gewinnen Sie mit unserem ausgefeilten DCF -Taschenrechner Einblicke in die Bewertungsanalyse der Progressive Corporation (PGR)! Diese Excel -Vorlage wird mit realen (PGR-) Daten vorinstalliert, sodass Sie Prognosen und Annahmen anpassen können, um den inneren Wert des progressiven Unternehmens genau zu bestimmen.
Discounted Cash Flow (DCF) - (USD MM)
| Year | AY1 2020 |
AY2 2021 |
AY3 2022 |
AY4 2023 |
AY5 2024 |
FY1 2025 |
FY2 2026 |
FY3 2027 |
FY4 2028 |
FY5 2029 |
|---|---|---|---|---|---|---|---|---|---|---|
| Revenue | 42,638.1 | 47,676.5 | 49,587.0 | 62,083.0 | 75,343.0 | 87,093.2 | 100,676.0 | 116,377.0 | 134,526.7 | 155,507.0 |
| Revenue Growth, % | 0 | 11.82 | 4.01 | 25.2 | 21.36 | 15.6 | 15.6 | 15.6 | 15.6 | 15.6 |
| EBITDA | 7,722.0 | 4,766.0 | 1,472.0 | 5,457.0 | 11,276.0 | 9,550.9 | 11,040.5 | 12,762.3 | 14,752.7 | 17,053.4 |
| EBITDA, % | 18.11 | 10 | 2.97 | 8.79 | 14.97 | 10.97 | 10.97 | 10.97 | 10.97 | 10.97 |
| Depreciation | 331.8 | 337.4 | 306.0 | 285.0 | 284.0 | 511.9 | 591.8 | 684.1 | 790.7 | 914.1 |
| Depreciation, % | 0.77818 | 0.70769 | 0.6171 | 0.45906 | 0.37694 | 0.58779 | 0.58779 | 0.58779 | 0.58779 | 0.58779 |
| EBIT | 7,390.2 | 4,428.6 | 1,166.0 | 5,172.0 | 10,992.0 | 9,039.0 | 10,448.7 | 12,078.2 | 13,961.9 | 16,139.4 |
| EBIT, % | 17.33 | 9.29 | 2.35 | 8.33 | 14.59 | 10.38 | 10.38 | 10.38 | 10.38 | 10.38 |
| Total Cash | 42,105.9 | 45,002.8 | 49,717.1 | 62,253.0 | 76,090.0 | 85,899.0 | 99,295.5 | 114,781.2 | 132,682.1 | 153,374.7 |
| Total Cash, percent | .0 | .0 | .0 | .0 | .0 | .0 | .0 | .0 | .0 | .0 |
| Account Receivables | 12,179.5 | 14,380.0 | 16,249.0 | 17,052.0 | 19,134.0 | 25,145.1 | 29,066.6 | 33,599.8 | 38,839.9 | 44,897.2 |
| Account Receivables, % | 28.56 | 30.16 | 32.77 | 27.47 | 25.4 | 28.87 | 28.87 | 28.87 | 28.87 | 28.87 |
| Inventories | .0 | .0 | .0 | .0 | .0 | .0 | .0 | .0 | .0 | .0 |
| Inventories, % | 0 | 0 | 0 | 0 | 0 | 0 | 0 | 0 | 0 | 0 |
| Accounts Payable | 4,955.8 | 6,069.1 | 5,532.8 | .0 | .0 | 6,185.4 | 7,150.1 | 8,265.2 | 9,554.2 | 11,044.3 |
| Accounts Payable, % | 11.62 | 12.73 | 11.16 | 0 | 0 | 7.1 | 7.1 | 7.1 | 7.1 | 7.1 |
| Capital Expenditure | -223.5 | -243.5 | -292.0 | -252.0 | -285.0 | -419.4 | -484.8 | -560.5 | -647.9 | -748.9 |
| Capital Expenditure, % | -0.52418 | -0.51073 | -0.58886 | -0.40591 | -0.37827 | -0.48159 | -0.48159 | -0.48159 | -0.48159 | -0.48159 |
| Tax Rate, % | 20.84 | 20.84 | 20.84 | 20.84 | 20.84 | 20.84 | 20.84 | 20.84 | 20.84 | 20.84 |
| EBITAT | 5,877.2 | 3,524.9 | 913.1 | 4,116.3 | 8,700.8 | 7,162.0 | 8,279.0 | 9,570.1 | 11,062.7 | 12,788.0 |
| Depreciation | ||||||||||
| Changes in Account Receivables | ||||||||||
| Changes in Inventories | ||||||||||
| Changes in Accounts Payable | ||||||||||
| Capital Expenditure | ||||||||||
| UFCF | -1,238.2 | 2,531.6 | -1,478.2 | -2,186.5 | 6,617.8 | 7,428.8 | 5,429.0 | 6,275.7 | 7,254.4 | 8,385.8 |
| WACC, % | 5.39 | 5.39 | 5.39 | 5.39 | 5.39 | 5.39 | 5.39 | 5.39 | 5.39 | 5.39 |
| PV UFCF | ||||||||||
| SUM PV UFCF | 29,630.8 | |||||||||
| Long Term Growth Rate, % | 2.00 | |||||||||
| Free cash flow (T + 1) | 8,554 | |||||||||
| Terminal Value | 252,539 | |||||||||
| Present Terminal Value | 194,264 | |||||||||
| Enterprise Value | 223,895 | |||||||||
| Net Debt | 6,750 | |||||||||
| Equity Value | 217,145 | |||||||||
| Diluted Shares Outstanding, MM | 588 | |||||||||
| Equity Value Per Share | 369.48 |
What You Will Receive
- Customizable Excel Template: A fully adjustable Excel-based DCF Calculator featuring pre-filled real PGR financial data.
- Actual Data: Historical figures and forward-looking projections (highlighted in the yellow cells).
- Forecasting Flexibility: Adjust key assumptions such as revenue growth, EBITDA %, and WACC.
- Instant Calculations: Quickly observe how your inputs affect The Progressive Corporation’s valuation.
- Professional Resource: Designed for investors, CFOs, consultants, and financial analysts.
- User-Friendly Interface: Organized for clarity and simplicity, complete with step-by-step guidance.
Key Features
- Accurate Financial Data for The Progressive Corporation (PGR): Gain access to reliable pre-loaded historical figures and future forecasts.
- Tailorable Forecast Parameters: Modify highlighted cells for WACC, growth rates, and profit margins as needed.
- Real-Time Calculations: Instant updates for DCF, Net Present Value (NPV), and cash flow assessments.
- User-Friendly Dashboard: Clear and concise charts and summaries for easy visualization of your valuation outcomes.
- Suitable for All Experience Levels: An intuitive layout designed for investors, CFOs, and consultants alike.
How It Works
- Download: Obtain the pre-built Excel file featuring The Progressive Corporation’s (PGR) financial data.
- Customize: Modify projections, including premium growth, loss ratios, and discount rates.
- Update Automatically: The intrinsic value and NPV calculations refresh in real-time.
- Test Scenarios: Generate various forecasts and assess results immediately.
- Make Decisions: Leverage the valuation insights to inform your investment approach.
Why Choose This Calculator for The Progressive Corporation (PGR)?
- Accurate Data: Real Progressive financials provide dependable valuation outcomes.
- Customizable: Modify essential parameters such as growth rates, WACC, and tax rates to align with your forecasts.
- Time-Saving: Pre-configured calculations save you the hassle of starting from the ground up.
- Professional-Grade Tool: Tailored for investors, analysts, and consultants in the insurance sector.
- User-Friendly: Easy-to-navigate design and clear instructions ensure accessibility for all users.
Who Should Use This Product?
- Investors: Evaluate The Progressive Corporation’s (PGR) valuation before making investment decisions.
- CFOs and Financial Analysts: Optimize valuation methodologies and assess financial forecasts.
- Startup Founders: Understand the valuation strategies of established companies like The Progressive Corporation (PGR).
- Consultants: Provide comprehensive valuation reports for clients utilizing The Progressive Corporation (PGR) as a benchmark.
- Students and Educators: Utilize real-time data to learn and teach valuation practices related to The Progressive Corporation (PGR).
What the Template Contains
- Historical Data: Includes The Progressive Corporation’s past financials and baseline forecasts.
- DCF and Levered DCF Models: Detailed templates to calculate The Progressive Corporation’s intrinsic value.
- WACC Sheet: Pre-built calculations for Weighted Average Cost of Capital.
- Editable Inputs: Modify key drivers like growth rates, EBITDA %, and CAPEX assumptions.
- Quarterly and Annual Statements: A complete breakdown of The Progressive Corporation’s financials.
- Interactive Dashboard: Visualize valuation results and projections dynamically.
Disclaimer
All information, articles, and product details provided on this website are for general informational and educational purposes only. We do not claim any ownership over, nor do we intend to infringe upon, any trademarks, copyrights, logos, brand names, or other intellectual property mentioned or depicted on this site. Such intellectual property remains the property of its respective owners, and any references here are made solely for identification or informational purposes, without implying any affiliation, endorsement, or partnership.
We make no representations or warranties, express or implied, regarding the accuracy, completeness, or suitability of any content or products presented. Nothing on this website should be construed as legal, tax, investment, financial, medical, or other professional advice. In addition, no part of this site—including articles or product references—constitutes a solicitation, recommendation, endorsement, advertisement, or offer to buy or sell any securities, franchises, or other financial instruments, particularly in jurisdictions where such activity would be unlawful.
All content is of a general nature and may not address the specific circumstances of any individual or entity. It is not a substitute for professional advice or services. Any actions you take based on the information provided here are strictly at your own risk. You accept full responsibility for any decisions or outcomes arising from your use of this website and agree to release us from any liability in connection with your use of, or reliance upon, the content or products found herein.