
|
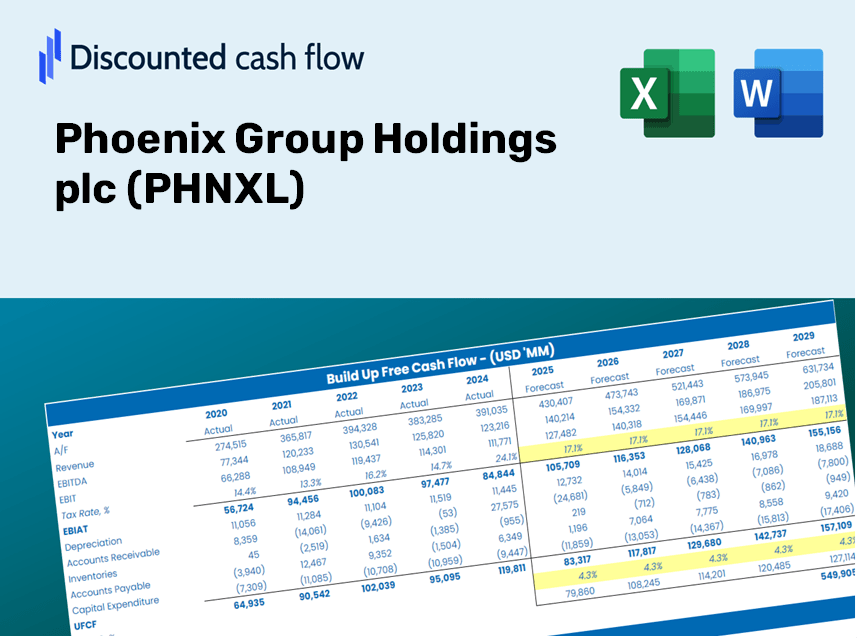
Phoenix Group Holdings Plc (PHNX.L) DCF -Bewertung |
Fully Editable: Tailor To Your Needs In Excel Or Sheets
Professional Design: Trusted, Industry-Standard Templates
Investor-Approved Valuation Models
MAC/PC Compatible, Fully Unlocked
No Expertise Is Needed; Easy To Follow
Phoenix Group Holdings plc (PHNX.L) Bundle
Vereinfachen Sie die PLC -Bewertung der Phoenix Group Holdings mit diesem anpassbaren DCF -Taschenrechner! Mit Real Phoenix Group Holdings Plc Financials und einstellbaren Prognoseeingaben können Sie Szenarien testen und die Fair -Wert der Phoenix Group Holdings Plc in Minuten aufdecken.
Discounted Cash Flow (DCF) - (USD MM)
| Year | AY1 2020 |
AY2 2021 |
AY3 2022 |
AY4 2023 |
AY5 2024 |
FY1 2025 |
FY2 2026 |
FY3 2027 |
FY4 2028 |
FY5 2029 |
|---|---|---|---|---|---|---|---|---|---|---|
| Revenue | 13,262.0 | 6,995.0 | 8,195.0 | 16,705.0 | 21,409.0 | 26,657.4 | 33,192.4 | 41,329.4 | 51,461.2 | 64,076.8 |
| Revenue Growth, % | 0 | -47.26 | 17.16 | 103.84 | 28.16 | 24.51 | 24.51 | 24.51 | 24.51 | 24.51 |
| EBITDA | 58.0 | -150.0 | -3,157.0 | 305.0 | -870.0 | -2,264.2 | -2,819.3 | -3,510.4 | -4,371.0 | -5,442.5 |
| EBITDA, % | 0.43734 | -2.14 | -38.52 | 1.83 | -4.06 | -8.49 | -8.49 | -8.49 | -8.49 | -8.49 |
| Depreciation | 487.0 | 644.0 | 25.0 | 27.0 | 294.0 | 784.7 | 977.1 | 1,216.6 | 1,514.9 | 1,886.2 |
| Depreciation, % | 3.67 | 9.21 | 0.30506 | 0.16163 | 1.37 | 2.94 | 2.94 | 2.94 | 2.94 | 2.94 |
| EBIT | -429.0 | -794.0 | -3,182.0 | 278.0 | -1,164.0 | -3,048.9 | -3,796.3 | -4,727.0 | -5,885.8 | -7,328.7 |
| EBIT, % | -3.23 | -11.35 | -38.83 | 1.66 | -5.44 | -11.44 | -11.44 | -11.44 | -11.44 | -11.44 |
| Total Cash | 414.0 | 405.0 | 242.0 | 174.0 | 198.0 | 737.4 | 918.2 | 1,143.3 | 1,423.5 | 1,772.5 |
| Total Cash, percent | .0 | .0 | .0 | .0 | .0 | .0 | .0 | .0 | .0 | .0 |
| Account Receivables | 933.0 | 1,693.0 | 750.0 | 842.0 | .0 | 2,422.1 | 3,015.9 | 3,755.2 | 4,675.8 | 5,822.1 |
| Account Receivables, % | 7.04 | 24.2 | 9.15 | 5.04 | 0 | 9.09 | 9.09 | 9.09 | 9.09 | 9.09 |
| Inventories | .0 | .0 | .0 | .0 | .0 | .0 | .0 | .0 | .0 | .0 |
| Inventories, % | 0 | 0 | 0 | 0 | 0 | 0 | 0 | 0 | 0 | 0 |
| Accounts Payable | 1,803.0 | 2,007.0 | 561.0 | .0 | 34.0 | 2,628.0 | 3,272.2 | 4,074.4 | 5,073.2 | 6,316.9 |
| Accounts Payable, % | 13.6 | 28.69 | 6.85 | 0 | 0.15881 | 9.86 | 9.86 | 9.86 | 9.86 | 9.86 |
| Capital Expenditure | .0 | .0 | .0 | .0 | -29.0 | -7.2 | -9.0 | -11.2 | -13.9 | -17.4 |
| Capital Expenditure, % | 0 | 0 | 0 | 0 | -0.13546 | -0.02709141 | -0.02709141 | -0.02709141 | -0.02709141 | -0.02709141 |
| Tax Rate, % | 25.03 | 25.03 | 25.03 | 25.03 | 25.03 | 25.03 | 25.03 | 25.03 | 25.03 | 25.03 |
| EBITAT | -269.6 | -1,545.5 | -2,468.0 | 199.6 | -872.6 | -2,360.8 | -2,939.6 | -3,660.2 | -4,557.5 | -5,674.7 |
| Depreciation | ||||||||||
| Changes in Account Receivables | ||||||||||
| Changes in Inventories | ||||||||||
| Changes in Accounts Payable | ||||||||||
| Capital Expenditure | ||||||||||
| UFCF | 1,087.4 | -1,457.5 | -2,946.0 | -426.4 | 268.4 | -1,411.5 | -1,921.0 | -2,391.9 | -2,978.3 | -3,708.4 |
| WACC, % | 6.79 | 7.84 | 7.21 | 7.04 | 7.13 | 7.2 | 7.2 | 7.2 | 7.2 | 7.2 |
| PV UFCF | ||||||||||
| SUM PV UFCF | -9,803.9 | |||||||||
| Long Term Growth Rate, % | 2.00 | |||||||||
| Free cash flow (T + 1) | -3,783 | |||||||||
| Terminal Value | -72,710 | |||||||||
| Present Terminal Value | -51,354 | |||||||||
| Enterprise Value | -61,158 | |||||||||
| Net Debt | -5,857 | |||||||||
| Equity Value | -55,301 | |||||||||
| Diluted Shares Outstanding, MM | 1,001 | |||||||||
| Equity Value Per Share | -5,524.57 |
Benefits of Choosing Phoenix Group Holdings plc (PHNXL)
- Comprehensive PHNXL Financials: Access both historical and projected data for precise valuation.
- Customizable Variables: Adjust inputs for WACC, tax rates, revenue growth, and capital expenditures.
- Real-Time Calculations: Automatically calculates intrinsic value and NPV as inputs change.
- Scenario Analysis Tools: Explore various scenarios to assess Phoenix Group’s future outlook.
- User-Friendly Design: Designed for professionals while remaining user-friendly for newcomers.
Key Features
- 🔍 Real-Life PHNXL Financials: Access pre-filled historical and projected data for Phoenix Group Holdings plc.
- ✏️ Fully Customizable Inputs: Modify all essential parameters (yellow cells) such as WACC, growth %, and tax rates.
- 📊 Professional DCF Valuation: Utilize built-in formulas to calculate the intrinsic value of Phoenix Group using the Discounted Cash Flow method.
- ⚡ Instant Results: View Phoenix’s valuation instantly after adjusting your inputs.
- Scenario Analysis: Evaluate and compare outcomes for different financial assumptions side-by-side.
How It Works
- Step 1: Download the Excel file.
- Step 2: Examine the pre-filled financial data and forecasts for Phoenix Group Holdings plc (PHNXL).
- Step 3: Adjust key inputs such as revenue growth, WACC, and tax rates (highlighted cells).
- Step 4: Observe the DCF model update in real-time as you modify assumptions.
- Step 5: Evaluate the outputs and leverage the findings for your investment strategies.
Why Opt for This Calculator?
- Precise Information: Genuine Phoenix Group Holdings plc (PHNXL) financials provide trustworthy valuation outcomes.
- Flexible Settings: Modify essential factors such as growth projections, WACC, and tax rates to align with your forecasts.
- Efficiency Boost: Built-in calculations save you from starting from the ground up.
- Expert-Level Tool: Crafted for investors, analysts, and consultants alike.
- Easy to Navigate: User-friendly design and clear, step-by-step guidance ensure accessibility for all users.
Who Can Benefit from Phoenix Group Holdings plc (PHNXL)?
- Investors: Gain assurance in your choices with a sophisticated valuation tool tailored for the market.
- Financial Analysts: Enhance efficiency using a ready-to-customize DCF model designed for quick deployment.
- Consultants: Easily modify the template for impactful client presentations and detailed reports.
- Finance Enthusiasts: Expand your knowledge of valuation methods through practical, real-life case studies.
- Educators and Students: Utilize it as an effective resource for hands-on learning in finance courses.
What the Template Contains
- Pre-Filled Data: Contains historical financials and forecasts for Phoenix Group Holdings plc (PHNXL).
- Discounted Cash Flow Model: An editable DCF valuation model featuring automatic calculations.
- Weighted Average Cost of Capital (WACC): A dedicated worksheet for WACC calculations based on customized inputs.
- Key Financial Ratios: Assess Phoenix Group’s profitability, efficiency, and leverage metrics.
- Customizable Inputs: Easily modify revenue growth rates, margins, and tax rates.
- Clear Dashboard: Visual representations through charts and tables summarizing essential valuation outcomes.
Disclaimer
All information, articles, and product details provided on this website are for general informational and educational purposes only. We do not claim any ownership over, nor do we intend to infringe upon, any trademarks, copyrights, logos, brand names, or other intellectual property mentioned or depicted on this site. Such intellectual property remains the property of its respective owners, and any references here are made solely for identification or informational purposes, without implying any affiliation, endorsement, or partnership.
We make no representations or warranties, express or implied, regarding the accuracy, completeness, or suitability of any content or products presented. Nothing on this website should be construed as legal, tax, investment, financial, medical, or other professional advice. In addition, no part of this site—including articles or product references—constitutes a solicitation, recommendation, endorsement, advertisement, or offer to buy or sell any securities, franchises, or other financial instruments, particularly in jurisdictions where such activity would be unlawful.
All content is of a general nature and may not address the specific circumstances of any individual or entity. It is not a substitute for professional advice or services. Any actions you take based on the information provided here are strictly at your own risk. You accept full responsibility for any decisions or outcomes arising from your use of this website and agree to release us from any liability in connection with your use of, or reliance upon, the content or products found herein.