
|
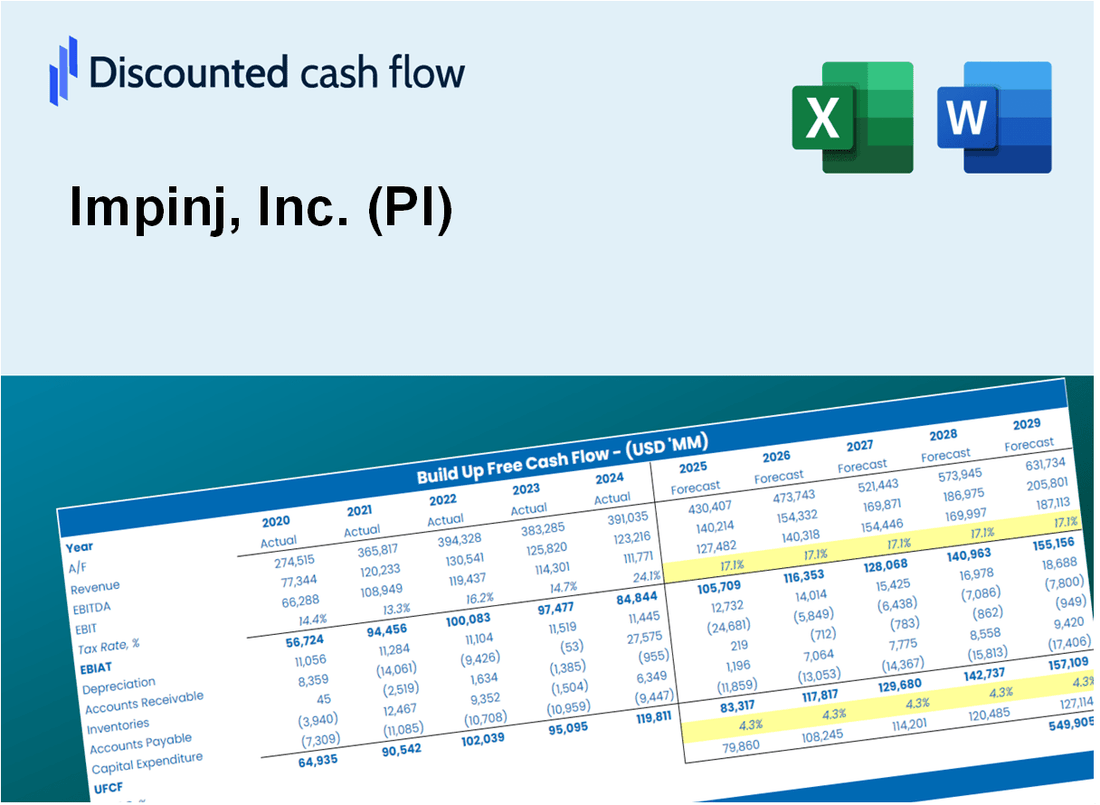
Impinj, Inc. (PI) DCF -Bewertung |
Fully Editable: Tailor To Your Needs In Excel Or Sheets
Professional Design: Trusted, Industry-Standard Templates
Investor-Approved Valuation Models
MAC/PC Compatible, Fully Unlocked
No Expertise Is Needed; Easy To Follow
Impinj, Inc. (PI) Bundle
Stürzen Sie Ihre Analyse und steigern Sie die Präzision mit unserem (PI) DCF -Taschenrechner! Durch die Verwendung realer Daten von Impinj, Inc. und anpassbaren Annahmen ermöglichen dieses Tool Sie, wie ein erfahrener Investor prognostizieren, analysieren und value (PI).
Discounted Cash Flow (DCF) - (USD MM)
| Year | AY1 2020 |
AY2 2021 |
AY3 2022 |
AY4 2023 |
AY5 2024 |
FY1 2025 |
FY2 2026 |
FY3 2027 |
FY4 2028 |
FY5 2029 |
|---|---|---|---|---|---|---|---|---|---|---|
| Revenue | 138.9 | 190.3 | 257.8 | 307.5 | 366.1 | 467.5 | 597.0 | 762.3 | 973.4 | 1,243.0 |
| Revenue Growth, % | 0 | 36.97 | 35.48 | 19.29 | 19.04 | 27.7 | 27.7 | 27.7 | 27.7 | 27.7 |
| EBITDA | -37.2 | -30.9 | -13.5 | -26.6 | 10.3 | -50.6 | -64.6 | -82.5 | -105.4 | -134.5 |
| EBITDA, % | -26.78 | -16.25 | -5.25 | -8.65 | 2.82 | -10.82 | -10.82 | -10.82 | -10.82 | -10.82 |
| Depreciation | 4.5 | 4.6 | 6.0 | 13.6 | 13.6 | 15.1 | 19.3 | 24.6 | 31.4 | 40.1 |
| Depreciation, % | 3.24 | 2.42 | 2.34 | 4.43 | 3.71 | 3.23 | 3.23 | 3.23 | 3.23 | 3.23 |
| EBIT | -41.7 | -35.5 | -19.6 | -40.2 | -3.3 | -65.7 | -83.9 | -107.1 | -136.8 | -174.7 |
| EBIT, % | -30.03 | -18.67 | -7.6 | -13.08 | -0.8935 | -14.05 | -14.05 | -14.05 | -14.05 | -14.05 |
| Total Cash | 106.1 | 193.3 | 173.7 | 113.2 | 164.7 | 304.4 | 388.7 | 496.4 | 633.8 | 809.4 |
| Total Cash, percent | .0 | .0 | .0 | .0 | .0 | .0 | .0 | .0 | .0 | .0 |
| Account Receivables | 25.0 | 35.4 | 50.0 | 54.9 | 56.8 | 83.6 | 106.7 | 136.3 | 174.0 | 222.2 |
| Account Receivables, % | 18 | 18.63 | 19.39 | 17.86 | 15.52 | 17.88 | 17.88 | 17.88 | 17.88 | 17.88 |
| Inventories | 36.3 | 22.0 | 46.4 | 97.2 | 99.3 | 107.0 | 136.6 | 174.4 | 222.8 | 284.5 |
| Inventories, % | 26.15 | 11.54 | 18 | 31.6 | 27.14 | 22.88 | 22.88 | 22.88 | 22.88 | 22.88 |
| Accounts Payable | 10.1 | 11.7 | 25.0 | 8.7 | 17.3 | 28.7 | 36.7 | 46.8 | 59.8 | 76.3 |
| Accounts Payable, % | 7.3 | 6.17 | 9.71 | 2.82 | 4.71 | 6.14 | 6.14 | 6.14 | 6.14 | 6.14 |
| Capital Expenditure | -3.1 | -16.2 | -12.1 | -18.6 | -17.1 | -24.4 | -31.2 | -39.9 | -50.9 | -65.0 |
| Capital Expenditure, % | -2.21 | -8.53 | -4.69 | -6.05 | -4.67 | -5.23 | -5.23 | -5.23 | -5.23 | -5.23 |
| Tax Rate, % | 0.38297 | 0.38297 | 0.38297 | 0.38297 | 0.38297 | 0.38297 | 0.38297 | 0.38297 | 0.38297 | 0.38297 |
| EBITAT | -41.8 | -35.6 | -19.7 | -39.9 | -3.3 | -65.5 | -83.7 | -106.9 | -136.5 | -174.3 |
| Depreciation | ||||||||||
| Changes in Account Receivables | ||||||||||
| Changes in Inventories | ||||||||||
| Changes in Accounts Payable | ||||||||||
| Capital Expenditure | ||||||||||
| UFCF | -91.5 | -41.7 | -51.5 | -116.9 | -2.2 | -97.9 | -140.5 | -179.4 | -229.0 | -292.5 |
| WACC, % | 10.27 | 10.27 | 10.27 | 10.27 | 10.27 | 10.27 | 10.27 | 10.27 | 10.27 | 10.27 |
| PV UFCF | ||||||||||
| SUM PV UFCF | -672.3 | |||||||||
| Long Term Growth Rate, % | 2.00 | |||||||||
| Free cash flow (T + 1) | -298 | |||||||||
| Terminal Value | -3,606 | |||||||||
| Present Terminal Value | -2,211 | |||||||||
| Enterprise Value | -2,883 | |||||||||
| Net Debt | 247 | |||||||||
| Equity Value | -3,130 | |||||||||
| Diluted Shares Outstanding, MM | 29 | |||||||||
| Equity Value Per Share | -106.21 |
What You Will Get
- Real PI Financials: Access to historical and projected data for precise valuation.
- Customizable Inputs: Adjust WACC, tax rates, revenue growth, and capital expenditures as needed.
- Dynamic Calculations: Intrinsic value and NPV are computed automatically.
- Scenario Analysis: Evaluate various scenarios to assess Impinj’s future performance.
- User-Friendly Design: Designed for professionals but easy enough for beginners to navigate.
Key Features
- Comprehensive Historical Data: Impinj, Inc. (PI) offers access to detailed historical financial statements and pre-filled projections.
- Customizable Parameters: Modify WACC, tax rates, revenue growth, and EBITDA margins to suit your analysis.
- Real-Time Valuation: Witness the intrinsic value of Impinj, Inc. (PI) update instantly as you adjust inputs.
- Intuitive Visualizations: Dashboard graphs present valuation outcomes and essential metrics clearly.
- Designed for Precision: A robust tool tailored for analysts, investors, and finance professionals.
How It Works
- Step 1: Download the prebuilt Excel template with Impinj, Inc.'s (PI) data included.
- Step 2: Explore the pre-filled sheets and familiarize yourself with the key metrics.
- Step 3: Update forecasts and assumptions in the editable yellow cells (WACC, growth, margins).
- Step 4: Instantly view recalculated results, including Impinj, Inc.'s (PI) intrinsic value.
- Step 5: Make informed investment decisions or generate reports using the outputs.
Why Choose Impinj, Inc. (PI)?
- Innovative Technology: Leverage cutting-edge solutions for efficient inventory management.
- Enhanced Performance: High-quality products ensure reliable and accurate data capture.
- Flexible Solutions: Customize offerings to meet specific business needs and objectives.
- User-Friendly Interface: Intuitive design allows for easy integration and operation.
- Industry Leader: Recognized for excellence by professionals in the RFID space.
Who Should Use This Product?
- Professional Investors: Develop comprehensive and accurate valuation models for portfolio assessments of Impinj, Inc. (PI).
- Corporate Finance Teams: Evaluate valuation scenarios to inform strategic decisions within their organizations.
- Consultants and Advisors: Deliver precise valuation insights for clients interested in investing in Impinj, Inc. (PI).
- Students and Educators: Utilize real-world data to enhance learning and practice in financial modeling.
- Tech Enthusiasts: Gain insights into how technology companies like Impinj, Inc. (PI) are appraised in the market.
What the Template Contains
- Operating and Balance Sheet Data: Pre-filled Impinj, Inc. (PI) historical data and forecasts, including revenue, EBITDA, EBIT, and capital expenditures.
- WACC Calculation: A dedicated sheet for Weighted Average Cost of Capital (WACC), featuring parameters like Beta, risk-free rate, and share price.
- DCF Valuation (Unlevered and Levered): Editable Discounted Cash Flow models showcasing intrinsic value with detailed calculations.
- Financial Statements: Pre-loaded financial statements (annual and quarterly) to facilitate analysis.
- Key Ratios: Includes profitability, leverage, and efficiency ratios for Impinj, Inc. (PI).
- Dashboard and Charts: Visual summary of valuation outputs and assumptions for easy result analysis.
Disclaimer
All information, articles, and product details provided on this website are for general informational and educational purposes only. We do not claim any ownership over, nor do we intend to infringe upon, any trademarks, copyrights, logos, brand names, or other intellectual property mentioned or depicted on this site. Such intellectual property remains the property of its respective owners, and any references here are made solely for identification or informational purposes, without implying any affiliation, endorsement, or partnership.
We make no representations or warranties, express or implied, regarding the accuracy, completeness, or suitability of any content or products presented. Nothing on this website should be construed as legal, tax, investment, financial, medical, or other professional advice. In addition, no part of this site—including articles or product references—constitutes a solicitation, recommendation, endorsement, advertisement, or offer to buy or sell any securities, franchises, or other financial instruments, particularly in jurisdictions where such activity would be unlawful.
All content is of a general nature and may not address the specific circumstances of any individual or entity. It is not a substitute for professional advice or services. Any actions you take based on the information provided here are strictly at your own risk. You accept full responsibility for any decisions or outcomes arising from your use of this website and agree to release us from any liability in connection with your use of, or reliance upon, the content or products found herein.