
|
Playtika Holding Corp. (PLTK) DCF -Bewertung |
Fully Editable: Tailor To Your Needs In Excel Or Sheets
Professional Design: Trusted, Industry-Standard Templates
Investor-Approved Valuation Models
MAC/PC Compatible, Fully Unlocked
No Expertise Is Needed; Easy To Follow
Playtika Holding Corp. (PLTK) Bundle
Vereinfachen Sie die Bewertung der Playtika Holding Corp. (PLTK) mit diesem anpassbaren DCF -Taschenrechner! Mit Real Playtika Holding Corp. (PLTK) -Fonds und einstellbaren Prognoseeingaben können Sie Szenarien testen und Playtika Holding Corp. (PLTK) in Minuten aufdecken.
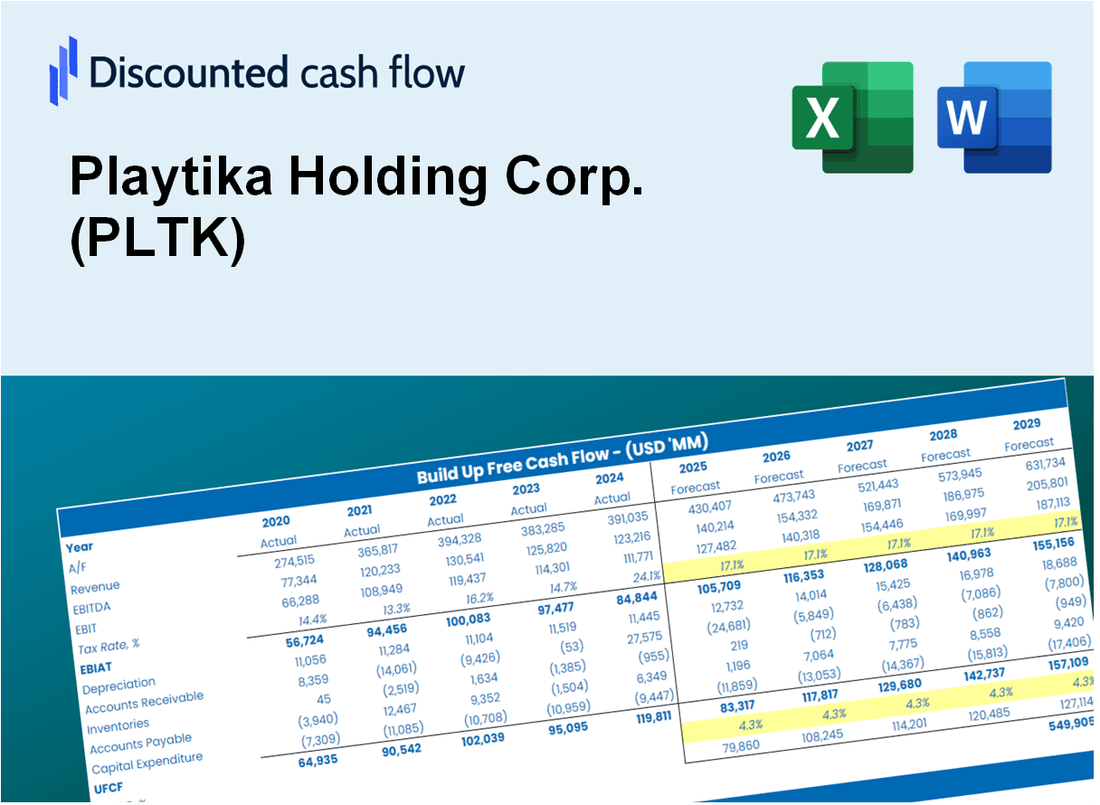
Discounted Cash Flow (DCF) - (USD MM)
| Year | AY1 2020 |
AY2 2021 |
AY3 2022 |
AY4 2023 |
AY5 2024 |
FY1 2025 |
FY2 2026 |
FY3 2027 |
FY4 2028 |
FY5 2029 |
|---|---|---|---|---|---|---|---|---|---|---|
| Revenue | 2,371.5 | 2,583.0 | 2,615.5 | 2,567.0 | 2,549.3 | 2,597.9 | 2,647.5 | 2,698.0 | 2,749.5 | 2,802.0 |
| Revenue Growth, % | 0 | 8.92 | 1.26 | -1.85 | -0.68952 | 1.91 | 1.91 | 1.91 | 1.91 | 1.91 |
| EBITDA | 511.9 | 703.1 | 640.3 | 704.3 | 601.4 | 645.9 | 658.2 | 670.8 | 683.6 | 696.7 |
| EBITDA, % | 21.59 | 27.22 | 24.48 | 27.44 | 23.59 | 24.86 | 24.86 | 24.86 | 24.86 | 24.86 |
| Depreciation | 119.2 | 145.5 | 162.0 | 158.0 | 165.7 | 153.3 | 156.2 | 159.2 | 162.3 | 165.4 |
| Depreciation, % | 5.03 | 5.63 | 6.19 | 6.16 | 6.5 | 5.9 | 5.9 | 5.9 | 5.9 | 5.9 |
| EBIT | 392.7 | 557.6 | 478.3 | 546.3 | 435.7 | 492.6 | 502.0 | 511.6 | 521.3 | 531.3 |
| EBIT, % | 16.56 | 21.59 | 18.29 | 21.28 | 17.09 | 18.96 | 18.96 | 18.96 | 18.96 | 18.96 |
| Total Cash | 520.1 | 1,117.1 | 768.7 | 1,029.7 | 565.8 | 815.1 | 830.7 | 846.5 | 862.7 | 879.1 |
| Total Cash, percent | .0 | .0 | .0 | .0 | .0 | .0 | .0 | .0 | .0 | .0 |
| Account Receivables | 129.3 | 143.7 | 141.1 | 171.5 | 187.6 | 158.2 | 161.2 | 164.3 | 167.4 | 170.6 |
| Account Receivables, % | 5.45 | 5.56 | 5.39 | 6.68 | 7.36 | 6.09 | 6.09 | 6.09 | 6.09 | 6.09 |
| Inventories | 21.3 | 22.7 | 1.7 | .0 | .0 | 9.6 | 9.8 | 9.9 | 10.1 | 10.3 |
| Inventories, % | 0.89817 | 0.87882 | 0.06499713 | 0 | 0 | 0.3684 | 0.3684 | 0.3684 | 0.3684 | 0.3684 |
| Accounts Payable | 34.6 | 45.7 | 50.7 | 65.0 | 58.6 | 51.9 | 52.9 | 53.9 | 55.0 | 56.0 |
| Accounts Payable, % | 1.46 | 1.77 | 1.94 | 2.53 | 2.3 | 2 | 2 | 2 | 2 | 2 |
| Capital Expenditure | -98.1 | -99.6 | -110.0 | -32.6 | -40.9 | -78.3 | -79.8 | -81.3 | -82.9 | -84.5 |
| Capital Expenditure, % | -4.14 | -3.86 | -4.21 | -1.27 | -1.6 | -3.01 | -3.01 | -3.01 | -3.01 | -3.01 |
| Tax Rate, % | 42.17 | 42.17 | 42.17 | 42.17 | 42.17 | 42.17 | 42.17 | 42.17 | 42.17 | 42.17 |
| EBITAT | 186.0 | 421.2 | 365.0 | 327.4 | 251.9 | 312.3 | 318.2 | 324.3 | 330.5 | 336.8 |
| Depreciation | ||||||||||
| Changes in Account Receivables | ||||||||||
| Changes in Inventories | ||||||||||
| Changes in Accounts Payable | ||||||||||
| Capital Expenditure | ||||||||||
| UFCF | 91.1 | 462.4 | 445.6 | 438.4 | 354.2 | 400.5 | 392.5 | 400.0 | 407.6 | 415.4 |
| WACC, % | 4.76 | 5.85 | 5.88 | 5.25 | 5.16 | 5.38 | 5.38 | 5.38 | 5.38 | 5.38 |
| PV UFCF | ||||||||||
| SUM PV UFCF | 1,725.3 | |||||||||
| Long Term Growth Rate, % | 3.00 | |||||||||
| Free cash flow (T + 1) | 428 | |||||||||
| Terminal Value | 17,973 | |||||||||
| Present Terminal Value | 13,830 | |||||||||
| Enterprise Value | 15,555 | |||||||||
| Net Debt | 1,931 | |||||||||
| Equity Value | 13,624 | |||||||||
| Diluted Shares Outstanding, MM | 372 | |||||||||
| Equity Value Per Share | 36.61 |
What You Will Get
- Real PLTK Financials: Access to historical and projected data for precise valuation.
- Customizable Inputs: Adjust WACC, tax rates, revenue growth, and capital expenditures as needed.
- Dynamic Calculations: Intrinsic value and NPV are computed in real-time.
- Scenario Analysis: Explore various scenarios to assess Playtika's future performance.
- User-Friendly Design: Crafted for professionals while remaining approachable for newcomers.
Key Features
- Pre-Loaded Data: Playtika’s historical financial statements and pre-filled forecasts.
- Fully Adjustable Inputs: Customize WACC, tax rates, revenue growth, and EBITDA margins.
- Instant Results: View Playtika’s intrinsic value recalculated in real time.
- Clear Visual Outputs: Dashboard charts showcase valuation results and key metrics.
- Built for Accuracy: A professional tool designed for analysts, investors, and finance experts.
How It Works
- Step 1: Download the Excel file.
- Step 2: Review pre-entered Playtika data (historical and projected).
- Step 3: Adjust key assumptions (yellow cells) based on your analysis.
- Step 4: View automatic recalculations for Playtika’s intrinsic value.
- Step 5: Use the outputs for investment decisions or reporting.
Why Choose This Calculator for Playtika Holding Corp. (PLTK)?
- Comprehensive Tool: Combines DCF, WACC, and financial ratio analyses specifically for Playtika Holding Corp. (PLTK).
- Customizable Inputs: Modify the yellow-highlighted cells to explore different scenarios for Playtika Holding Corp. (PLTK).
- Detailed Insights: Automatically computes Playtika Holding Corp.'s (PLTK) intrinsic value and Net Present Value.
- Preloaded Data: Access historical and forecasted data tailored to Playtika Holding Corp. (PLTK) for precise calculations.
- Professional Quality: Perfect for financial analysts, investors, and business consultants focusing on Playtika Holding Corp. (PLTK).
Who Should Use Playtika's Products?
- Game Developers: Leverage advanced tools to enhance game design and user experience.
- Data Analysts: Utilize robust analytics to gain insights into player behavior and trends.
- Marketing Professionals: Quickly tailor campaigns based on player engagement metrics.
- Investors: Make informed decisions with comprehensive data on market performance.
- Students and Educators: Use Playtika's resources as a practical case study in gaming and business courses.
What the Template Contains
- Preloaded PLTK Data: Historical and projected financial data, including revenue, EBIT, and capital expenditures.
- DCF and WACC Models: Professional-grade sheets for calculating intrinsic value and Weighted Average Cost of Capital.
- Editable Inputs: Yellow-highlighted cells for adjusting revenue growth, tax rates, and discount rates.
- Financial Statements: Comprehensive annual and quarterly financials for deeper analysis.
- Key Ratios: Profitability, leverage, and efficiency ratios to evaluate performance.
- Dashboard and Charts: Visual summaries of valuation outcomes and assumptions.
Disclaimer
All information, articles, and product details provided on this website are for general informational and educational purposes only. We do not claim any ownership over, nor do we intend to infringe upon, any trademarks, copyrights, logos, brand names, or other intellectual property mentioned or depicted on this site. Such intellectual property remains the property of its respective owners, and any references here are made solely for identification or informational purposes, without implying any affiliation, endorsement, or partnership.
We make no representations or warranties, express or implied, regarding the accuracy, completeness, or suitability of any content or products presented. Nothing on this website should be construed as legal, tax, investment, financial, medical, or other professional advice. In addition, no part of this site—including articles or product references—constitutes a solicitation, recommendation, endorsement, advertisement, or offer to buy or sell any securities, franchises, or other financial instruments, particularly in jurisdictions where such activity would be unlawful.
All content is of a general nature and may not address the specific circumstances of any individual or entity. It is not a substitute for professional advice or services. Any actions you take based on the information provided here are strictly at your own risk. You accept full responsibility for any decisions or outcomes arising from your use of this website and agree to release us from any liability in connection with your use of, or reliance upon, the content or products found herein.