
|
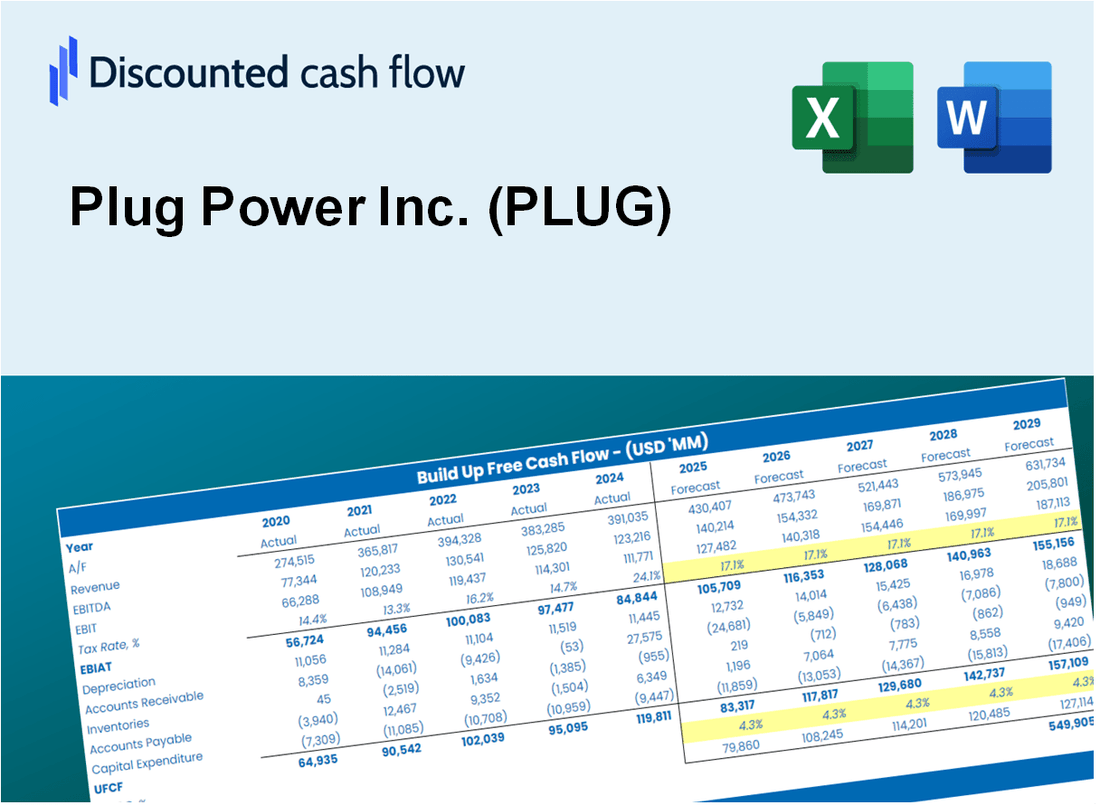
Plug Power Inc. (Plug) DCF -Bewertung |
Fully Editable: Tailor To Your Needs In Excel Or Sheets
Professional Design: Trusted, Industry-Standard Templates
Investor-Approved Valuation Models
MAC/PC Compatible, Fully Unlocked
No Expertise Is Needed; Easy To Follow
Plug Power Inc. (PLUG) Bundle
Vereinfachen Sie die Bewertung von Plug Power Inc. (Plug) mit diesem anpassbaren DCF -Taschenrechner! Mit Real Plug Power Inc. (Plug) Financials und einstellbaren Prognose -Eingängen können Sie Szenarien testen und Plug Power Inc. (Plug) -Fairwert in Minuten entdecken.
Discounted Cash Flow (DCF) - (USD MM)
| Year | AY1 2020 |
AY2 2021 |
AY3 2022 |
AY4 2023 |
AY5 2024 |
FY1 2025 |
FY2 2026 |
FY3 2027 |
FY4 2028 |
FY5 2029 |
|---|---|---|---|---|---|---|---|---|---|---|
| Revenue | -93.2 | 502.3 | 701.4 | 891.3 | 628.8 | 530.2 | 447.0 | 376.9 | 317.8 | 267.9 |
| Revenue Growth, % | 0 | -638.78 | 39.63 | 27.07 | -29.45 | -15.69 | -15.69 | -15.69 | -15.69 | -15.69 |
| EBITDA | -550.9 | -409.6 | -632.5 | -1,259.9 | -1,976.4 | -288.1 | -242.9 | -204.8 | -172.7 | -145.6 |
| EBITDA, % | 590.88 | -81.53 | -90.18 | -141.35 | -314.31 | -54.34 | -54.34 | -54.34 | -54.34 | -54.34 |
| Depreciation | 15.6 | 23.4 | 51.6 | 71.1 | 84.6 | 17.7 | 15.0 | 12.6 | 10.6 | 9.0 |
| Depreciation, % | -16.7 | 4.65 | 7.36 | 7.97 | 13.45 | 3.35 | 3.35 | 3.35 | 3.35 | 3.35 |
| EBIT | -566.5 | -432.9 | -684.1 | -1,331.0 | -2,061.0 | -300.8 | -253.6 | -213.9 | -180.3 | -152.0 |
| EBIT, % | 607.58 | -86.18 | -97.53 | -149.33 | -327.75 | -56.74 | -56.74 | -56.74 | -56.74 | -56.74 |
| Total Cash | 448.1 | 3,869.5 | 2,158.4 | 135.0 | 205.7 | 156.8 | 132.2 | 111.5 | 94.0 | 79.2 |
| Total Cash, percent | .0 | .0 | .0 | .0 | .0 | .0 | .0 | .0 | .0 | .0 |
| Account Receivables | 113.5 | 131.3 | 191.9 | 370.1 | 251.3 | 37.1 | 31.3 | 26.4 | 22.2 | 18.7 |
| Account Receivables, % | -121.74 | 26.14 | 27.36 | 41.52 | 39.96 | 7 | 7 | 7 | 7 | 7 |
| Inventories | 134.2 | 269.2 | 645.6 | 961.3 | 682.6 | 260.4 | 219.6 | 185.1 | 156.1 | 131.6 |
| Inventories, % | -143.94 | 53.58 | 92.04 | 107.84 | 108.56 | 49.13 | 49.13 | 49.13 | 49.13 | 49.13 |
| Accounts Payable | 58.8 | 129.0 | 191.9 | 257.8 | 220.8 | 57.3 | 48.3 | 40.7 | 34.3 | 28.9 |
| Accounts Payable, % | -63.06 | 25.68 | 27.36 | 28.93 | 35.11 | 10.8 | 10.8 | 10.8 | 10.8 | 10.8 |
| Capital Expenditure | -50.2 | -193.3 | -463.9 | -696.1 | -334.2 | -250.1 | -210.9 | -177.8 | -149.9 | -126.4 |
| Capital Expenditure, % | 53.86 | -38.47 | -66.13 | -78.1 | -53.16 | -47.17 | -47.17 | -47.17 | -47.17 | -47.17 |
| Tax Rate, % | 0.13712 | 0.13712 | 0.13712 | 0.13712 | 0.13712 | 0.13712 | 0.13712 | 0.13712 | 0.13712 | 0.13712 |
| EBITAT | -538.6 | -418.2 | -684.9 | -1,323.9 | -2,058.1 | -295.4 | -249.1 | -210.0 | -177.1 | -149.3 |
| Depreciation | ||||||||||
| Changes in Account Receivables | ||||||||||
| Changes in Inventories | ||||||||||
| Changes in Accounts Payable | ||||||||||
| Capital Expenditure | ||||||||||
| UFCF | -762.2 | -670.7 | -1,471.4 | -2,376.8 | -1,947.5 | -54.9 | -407.3 | -343.4 | -289.5 | -244.1 |
| WACC, % | 9.1 | 9.13 | 9.18 | 9.17 | 9.18 | 9.15 | 9.15 | 9.15 | 9.15 | 9.15 |
| PV UFCF | ||||||||||
| SUM PV UFCF | -1,017.8 | |||||||||
| Long Term Growth Rate, % | 2.00 | |||||||||
| Free cash flow (T + 1) | -249 | |||||||||
| Terminal Value | -3,482 | |||||||||
| Present Terminal Value | -2,248 | |||||||||
| Enterprise Value | -3,266 | |||||||||
| Net Debt | 873 | |||||||||
| Equity Value | -4,138 | |||||||||
| Diluted Shares Outstanding, MM | 858 | |||||||||
| Equity Value Per Share | -4.82 |
What You Will Get
- Real PLUG Financial Data: Pre-filled with Plug Power’s historical and projected data for precise analysis.
- Fully Editable Template: Modify key inputs like revenue growth, WACC, and EBITDA % with ease.
- Automatic Calculations: See Plug Power’s intrinsic value update instantly based on your changes.
- Professional Valuation Tool: Designed for investors, analysts, and consultants seeking accurate DCF results.
- User-Friendly Design: Simple structure and clear instructions for all experience levels.
Key Features
- 🔍 Real-Life PLUG Financials: Pre-filled historical and projected data for Plug Power Inc.
- ✏️ Fully Customizable Inputs: Adjust all critical parameters (yellow cells) like WACC, growth %, and tax rates.
- 📊 Professional DCF Valuation: Built-in formulas calculate Plug Power’s intrinsic value using the Discounted Cash Flow method.
- ⚡ Instant Results: Visualize Plug Power’s valuation instantly after making changes.
- Scenario Analysis: Test and compare outcomes for various financial assumptions side-by-side.
How It Works
- 1. Access the Model: Download and open the Excel template featuring Plug Power Inc.'s (PLUG) data.
- 2. Customize Inputs: Adjust essential variables such as growth projections, WACC, and capital expenditures.
- 3. Analyze Results Immediately: The DCF model automatically computes intrinsic value and NPV based on your inputs.
- 4. Explore Different Scenarios: Evaluate various forecasts to understand potential valuation impacts.
- 5. Present with Assurance: Deliver professional valuation analyses to enhance your decision-making process.
Why Choose This Calculator for Plug Power Inc. (PLUG)?
- Designed for Industry Experts: A sophisticated tool tailored for analysts, CFOs, and energy consultants.
- Accurate Data Integration: Plug Power’s historical and projected financials are preloaded for precise calculations.
- Flexible Scenario Analysis: Effortlessly simulate various forecasts and assumptions.
- Concise Results: Automatically computes intrinsic value, NPV, and essential metrics.
- User-Friendly Interface: Step-by-step guidance ensures a seamless experience.
Who Should Use This Product?
- Energy Sector Students: Explore fuel cell technologies and apply them using real data from Plug Power Inc. (PLUG).
- Researchers: Integrate cutting-edge models into academic studies or publications related to renewable energy.
- Investors: Validate your investment strategies and evaluate the performance of Plug Power Inc. (PLUG) in the market.
- Market Analysts: Enhance your analysis with a customizable financial model tailored for Plug Power Inc. (PLUG).
- Entrepreneurs: Understand the market dynamics of innovative companies like Plug Power Inc. (PLUG) and their impact on the energy landscape.
What the Template Contains
- Pre-Filled Data: Includes Plug Power Inc.'s (PLUG) historical financials and forecasts.
- Discounted Cash Flow Model: Editable DCF valuation model with automatic calculations.
- Weighted Average Cost of Capital (WACC): A dedicated sheet for calculating WACC based on custom inputs.
- Key Financial Ratios: Analyze Plug Power Inc.'s (PLUG) profitability, efficiency, and leverage.
- Customizable Inputs: Edit revenue growth, margins, and tax rates with ease.
- Clear Dashboard: Charts and tables summarizing key valuation results.
Disclaimer
All information, articles, and product details provided on this website are for general informational and educational purposes only. We do not claim any ownership over, nor do we intend to infringe upon, any trademarks, copyrights, logos, brand names, or other intellectual property mentioned or depicted on this site. Such intellectual property remains the property of its respective owners, and any references here are made solely for identification or informational purposes, without implying any affiliation, endorsement, or partnership.
We make no representations or warranties, express or implied, regarding the accuracy, completeness, or suitability of any content or products presented. Nothing on this website should be construed as legal, tax, investment, financial, medical, or other professional advice. In addition, no part of this site—including articles or product references—constitutes a solicitation, recommendation, endorsement, advertisement, or offer to buy or sell any securities, franchises, or other financial instruments, particularly in jurisdictions where such activity would be unlawful.
All content is of a general nature and may not address the specific circumstances of any individual or entity. It is not a substitute for professional advice or services. Any actions you take based on the information provided here are strictly at your own risk. You accept full responsibility for any decisions or outcomes arising from your use of this website and agree to release us from any liability in connection with your use of, or reliance upon, the content or products found herein.