
|
Protalix Biotherapeutics, Inc. (PLX) DCF -Bewertung |
Fully Editable: Tailor To Your Needs In Excel Or Sheets
Professional Design: Trusted, Industry-Standard Templates
Investor-Approved Valuation Models
MAC/PC Compatible, Fully Unlocked
No Expertise Is Needed; Easy To Follow
Protalix BioTherapeutics, Inc. (PLX) Bundle
Möchten Sie den inneren Wert von Protalix Biotherapeutics, Inc. bewerten? Unser (PLX) DCF-Taschenrechner integriert reale Daten mit umfangreichen Anpassungsfunktionen, sodass Sie Prognosen anpassen und Ihre Investitionsauswahl verbessern können.
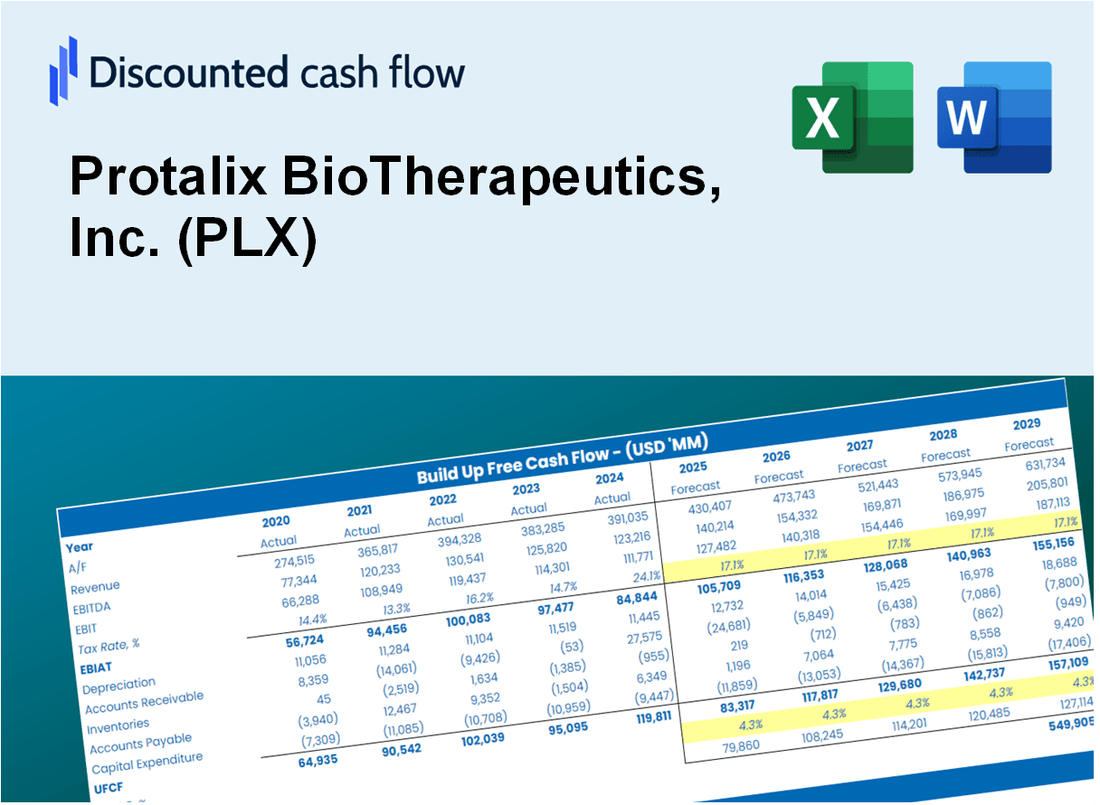
Discounted Cash Flow (DCF) - (USD MM)
| Year | AY1 2020 |
AY2 2021 |
AY3 2022 |
AY4 2023 |
AY5 2024 |
FY1 2025 |
FY2 2026 |
FY3 2027 |
FY4 2028 |
FY5 2029 |
|---|---|---|---|---|---|---|---|---|---|---|
| Revenue | 62.9 | 38.4 | 47.6 | 65.5 | 53.4 | 54.0 | 54.5 | 55.1 | 55.7 | 56.3 |
| Revenue Growth, % | 0 | -39.03 | 24.22 | 37.48 | -18.47 | 1.05 | 1.05 | 1.05 | 1.05 | 1.05 |
| EBITDA | 4.5 | -18.9 | -10.8 | 12.9 | 6.5 | -3.6 | -3.6 | -3.6 | -3.7 | -3.7 |
| EBITDA, % | 7.07 | -49.4 | -22.63 | 19.75 | 12.21 | -6.6 | -6.6 | -6.6 | -6.6 | -6.6 |
| Depreciation | 1.3 | 1.1 | 1.1 | 1.2 | 1.3 | 1.2 | 1.3 | 1.3 | 1.3 | 1.3 |
| Depreciation, % | 2.07 | 2.92 | 2.28 | 1.82 | 2.44 | 2.31 | 2.31 | 2.31 | 2.31 | 2.31 |
| EBIT | 3.1 | -20.1 | -11.9 | 11.7 | 5.2 | -4.8 | -4.9 | -4.9 | -5.0 | -5.0 |
| EBIT, % | 5 | -52.31 | -24.91 | 17.93 | 9.77 | -8.9 | -8.9 | -8.9 | -8.9 | -8.9 |
| Total Cash | 38.5 | 39.0 | 22.2 | 44.6 | 34.8 | 36.8 | 37.2 | 37.6 | 38.0 | 38.4 |
| Total Cash, percent | .0 | .0 | .0 | .0 | .0 | .0 | .0 | .0 | .0 | .0 |
| Account Receivables | 2.0 | 3.4 | 4.6 | 5.3 | 2.9 | 3.8 | 3.8 | 3.9 | 3.9 | 4.0 |
| Account Receivables, % | 3.18 | 8.98 | 9.63 | 8.05 | 5.45 | 7.06 | 7.06 | 7.06 | 7.06 | 7.06 |
| Inventories | 13.1 | 18.0 | 16.8 | 19.0 | 21.2 | 18.5 | 18.7 | 18.9 | 19.1 | 19.3 |
| Inventories, % | 20.8 | 46.82 | 35.27 | 29.08 | 39.78 | 34.35 | 34.35 | 34.35 | 34.35 | 34.35 |
| Accounts Payable | 7.2 | 7.0 | 5.9 | 4.3 | 4.5 | 6.2 | 6.2 | 6.3 | 6.4 | 6.4 |
| Accounts Payable, % | 11.48 | 18.22 | 12.31 | 6.6 | 8.49 | 11.42 | 11.42 | 11.42 | 11.42 | 11.42 |
| Capital Expenditure | -.7 | -1.5 | -.6 | -1.1 | -1.3 | -1.1 | -1.1 | -1.1 | -1.1 | -1.2 |
| Capital Expenditure, % | -1.04 | -3.8 | -1.32 | -1.75 | -2.4 | -2.06 | -2.06 | -2.06 | -2.06 | -2.06 |
| Tax Rate, % | 29.42 | 29.42 | 29.42 | 29.42 | 29.42 | 29.42 | 29.42 | 29.42 | 29.42 | 29.42 |
| EBITAT | 3.1 | -20.1 | -12.3 | 11.4 | 3.7 | -4.5 | -4.5 | -4.6 | -4.6 | -4.7 |
| Depreciation | ||||||||||
| Changes in Account Receivables | ||||||||||
| Changes in Inventories | ||||||||||
| Changes in Accounts Payable | ||||||||||
| Capital Expenditure | ||||||||||
| UFCF | -4.1 | -27.0 | -13.0 | 7.0 | 4.1 | -.9 | -4.6 | -4.6 | -4.7 | -4.7 |
| WACC, % | 5.2 | 5.2 | 5.2 | 5.18 | 5 | 5.15 | 5.15 | 5.15 | 5.15 | 5.15 |
| PV UFCF | ||||||||||
| SUM PV UFCF | -16.5 | |||||||||
| Long Term Growth Rate, % | 2.00 | |||||||||
| Free cash flow (T + 1) | -5 | |||||||||
| Terminal Value | -153 | |||||||||
| Present Terminal Value | -119 | |||||||||
| Enterprise Value | -135 | |||||||||
| Net Debt | -14 | |||||||||
| Equity Value | -121 | |||||||||
| Diluted Shares Outstanding, MM | 81 | |||||||||
| Equity Value Per Share | -1.49 |
What You Will Receive
- Comprehensive Financial Model: Protalix BioTherapeutics' actual data facilitates accurate DCF valuation.
- Complete Forecast Flexibility: Modify revenue growth, profit margins, WACC, and other essential factors.
- Real-Time Calculations: Automatic updates provide immediate feedback as you adjust parameters.
- Professional-Grade Template: A polished Excel file crafted for high-quality valuation presentations.
- Adaptable and Reusable: Designed for versatility, allowing for ongoing use in detailed financial projections.
Key Features
- Customizable Clinical Parameters: Adjust essential metrics such as patient response rates, treatment efficacy, and cost of goods sold.
- Instant DCF Valuation: Quickly computes intrinsic value, NPV, and other key financial metrics.
- Industry-Leading Precision: Leverages Protalix BioTherapeutics' (PLX) actual financial data for accurate valuation results.
- Effortless Scenario Analysis: Evaluate various assumptions and assess different outcomes with ease.
- Efficiency Booster: Remove the hassle of constructing intricate valuation models from the ground up.
How It Works
- Step 1: Download the Excel file for Protalix BioTherapeutics, Inc. (PLX).
- Step 2: Review Protalix's pre-filled financial data and forecasts.
- Step 3: Modify key inputs such as revenue growth, WACC, and tax rates (highlighted cells).
- Step 4: Observe the DCF model update in real-time as you adjust your assumptions.
- Step 5: Analyze the outputs and utilize the results for informed investment decisions.
Why Choose This Calculator for Protalix BioTherapeutics, Inc. (PLX)?
- Designed for Industry Experts: A sophisticated tool tailored for biopharmaceutical analysts, financial officers, and consultants.
- Up-to-Date Data: Protalix's historical and projected financials are preloaded for precision.
- Flexible Scenario Analysis: Effortlessly simulate various forecasts and assumptions.
- Comprehensive Outputs: Automatically computes intrinsic value, NPV, and essential metrics.
- User-Friendly Interface: Step-by-step guidance ensures a smooth calculation process.
Who Should Use This Product?
- Professional Investors: Develop comprehensive and accurate valuation models for assessing Protalix BioTherapeutics, Inc. (PLX) investments.
- Corporate Finance Teams: Evaluate valuation scenarios to inform strategic decisions within their organizations.
- Consultants and Advisors: Deliver precise valuation insights for clients interested in Protalix BioTherapeutics, Inc. (PLX).
- Students and Educators: Utilize real-world data to enhance financial modeling skills and educational practices.
- Biotech Enthusiasts: Gain insights into how biotechnology companies like Protalix BioTherapeutics, Inc. (PLX) are valued in the financial market.
What the Template Contains
- Pre-Filled Data: Includes Protalix BioTherapeutics’ historical financials and forecasts.
- Discounted Cash Flow Model: Editable DCF valuation model with automatic calculations.
- Weighted Average Cost of Capital (WACC): A dedicated sheet for calculating WACC based on custom inputs.
- Key Financial Ratios: Analyze Protalix BioTherapeutics’ profitability, efficiency, and leverage.
- Customizable Inputs: Edit revenue growth, margins, and tax rates with ease.
- Clear Dashboard: Charts and tables summarizing key valuation results.
Disclaimer
All information, articles, and product details provided on this website are for general informational and educational purposes only. We do not claim any ownership over, nor do we intend to infringe upon, any trademarks, copyrights, logos, brand names, or other intellectual property mentioned or depicted on this site. Such intellectual property remains the property of its respective owners, and any references here are made solely for identification or informational purposes, without implying any affiliation, endorsement, or partnership.
We make no representations or warranties, express or implied, regarding the accuracy, completeness, or suitability of any content or products presented. Nothing on this website should be construed as legal, tax, investment, financial, medical, or other professional advice. In addition, no part of this site—including articles or product references—constitutes a solicitation, recommendation, endorsement, advertisement, or offer to buy or sell any securities, franchises, or other financial instruments, particularly in jurisdictions where such activity would be unlawful.
All content is of a general nature and may not address the specific circumstances of any individual or entity. It is not a substitute for professional advice or services. Any actions you take based on the information provided here are strictly at your own risk. You accept full responsibility for any decisions or outcomes arising from your use of this website and agree to release us from any liability in connection with your use of, or reliance upon, the content or products found herein.