
|
PNC Infratech Limited (PNCinfra.NS) DCF -Bewertung |
Fully Editable: Tailor To Your Needs In Excel Or Sheets
Professional Design: Trusted, Industry-Standard Templates
Investor-Approved Valuation Models
MAC/PC Compatible, Fully Unlocked
No Expertise Is Needed; Easy To Follow
PNC Infratech Limited (PNCINFRA.NS) Bundle
Stürzen Sie Ihre Analyse und verbessern Sie die Präzision mit unserem DCF -Taschenrechner von PNC Infratech Limited (PNCinFrans)! Mithilfe aktueller Daten und anpassbarer Annahmen ermöglichen dieses Tool Sie, PNC Infratech Limited wie ein erfahrener Investor zu prognostizieren, zu bewerten und zu bewerten.
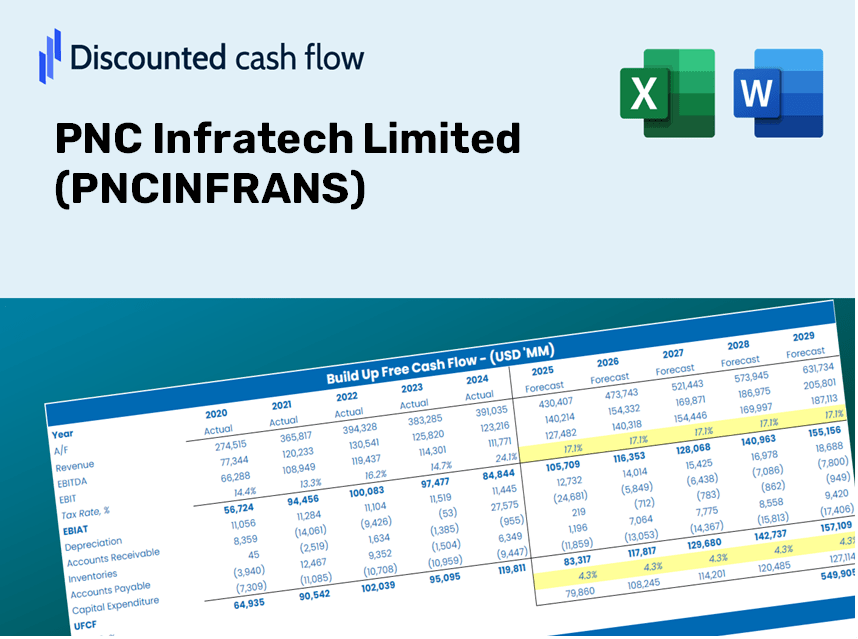
Discounted Cash Flow (DCF) - (USD MM)
| Year | AY1 2021 |
AY2 2022 |
AY3 2023 |
AY4 2024 |
AY5 2025 |
FY1 2026 |
FY2 2027 |
FY3 2028 |
FY4 2029 |
FY5 2030 |
|---|---|---|---|---|---|---|---|---|---|---|
| Revenue | 55,810.0 | 70,216.9 | 79,560.8 | 86,498.7 | 67,686.8 | 72,102.3 | 76,805.8 | 81,816.1 | 87,153.3 | 92,838.6 |
| Revenue Growth, % | 0 | 25.81 | 13.31 | 8.72 | -21.75 | 6.52 | 6.52 | 6.52 | 6.52 | 6.52 |
| EBITDA | 15,276.0 | 16,164.4 | 16,298.3 | 20,597.5 | 22,378.4 | 18,422.4 | 19,624.1 | 20,904.3 | 22,267.9 | 23,720.6 |
| EBITDA, % | 27.37 | 23.02 | 20.49 | 23.81 | 33.06 | 25.55 | 25.55 | 25.55 | 25.55 | 25.55 |
| Depreciation | 3,616.5 | 3,850.2 | 2,532.4 | 1,767.0 | 1,945.2 | 2,893.2 | 3,081.9 | 3,282.9 | 3,497.1 | 3,725.2 |
| Depreciation, % | 6.48 | 5.48 | 3.18 | 2.04 | 2.87 | 4.01 | 4.01 | 4.01 | 4.01 | 4.01 |
| EBIT | 11,659.5 | 12,314.1 | 13,765.9 | 18,830.4 | 20,433.3 | 15,529.2 | 16,542.2 | 17,621.3 | 18,770.8 | 19,995.3 |
| EBIT, % | 20.89 | 17.54 | 17.3 | 21.77 | 30.19 | 21.54 | 21.54 | 21.54 | 21.54 | 21.54 |
| Total Cash | 14,019.4 | 10,496.2 | 9,366.9 | 17,931.6 | 24,334.1 | 15,649.5 | 16,670.4 | 17,757.8 | 18,916.2 | 20,150.2 |
| Total Cash, percent | .0 | .0 | .0 | .0 | .0 | .0 | .0 | .0 | .0 | .0 |
| Account Receivables | 6,763.2 | 9,421.7 | 11,579.1 | 16,329.5 | 12,545.0 | 11,176.2 | 11,905.2 | 12,681.9 | 13,509.1 | 14,390.4 |
| Account Receivables, % | 12.12 | 13.42 | 14.55 | 18.88 | 18.53 | 15.5 | 15.5 | 15.5 | 15.5 | 15.5 |
| Inventories | 3,535.9 | 4,807.9 | 7,643.9 | 7,650.1 | 8,610.5 | 6,396.3 | 6,813.6 | 7,258.1 | 7,731.5 | 8,235.9 |
| Inventories, % | 6.34 | 6.85 | 9.61 | 8.84 | 12.72 | 8.87 | 8.87 | 8.87 | 8.87 | 8.87 |
| Accounts Payable | 5,608.4 | 4,146.2 | 6,882.2 | 9,530.0 | 8,737.8 | 6,998.4 | 7,454.9 | 7,941.2 | 8,459.2 | 9,011.1 |
| Accounts Payable, % | 10.05 | 5.9 | 8.65 | 11.02 | 12.91 | 9.71 | 9.71 | 9.71 | 9.71 | 9.71 |
| Capital Expenditure | -1,881.2 | -810.1 | -632.7 | -506.8 | -348.4 | -925.8 | -986.2 | -1,050.6 | -1,119.1 | -1,192.1 |
| Capital Expenditure, % | -3.37 | -1.15 | -0.79521 | -0.5859 | -0.51471 | -1.28 | -1.28 | -1.28 | -1.28 | -1.28 |
| Tax Rate, % | 31.57 | 31.57 | 31.57 | 31.57 | 31.57 | 31.57 | 31.57 | 31.57 | 31.57 | 31.57 |
| EBITAT | 7,793.0 | 8,863.0 | 9,466.9 | 13,713.6 | 13,983.0 | 10,834.5 | 11,541.3 | 12,294.1 | 13,096.1 | 13,950.4 |
| Depreciation | ||||||||||
| Changes in Account Receivables | ||||||||||
| Changes in Inventories | ||||||||||
| Changes in Accounts Payable | ||||||||||
| Capital Expenditure | ||||||||||
| UFCF | 4,837.6 | 6,510.4 | 9,109.2 | 12,865.1 | 17,611.7 | 14,645.4 | 12,947.1 | 13,791.7 | 14,691.4 | 15,649.8 |
| WACC, % | 5.61 | 5.87 | 5.71 | 5.92 | 5.69 | 5.76 | 5.76 | 5.76 | 5.76 | 5.76 |
| PV UFCF | ||||||||||
| SUM PV UFCF | 60,650.9 | |||||||||
| Long Term Growth Rate, % | 3.00 | |||||||||
| Free cash flow (T + 1) | 16,119 | |||||||||
| Terminal Value | 583,832 | |||||||||
| Present Terminal Value | 441,226 | |||||||||
| Enterprise Value | 501,877 | |||||||||
| Net Debt | 77,208 | |||||||||
| Equity Value | 424,669 | |||||||||
| Diluted Shares Outstanding, MM | 257 | |||||||||
| Equity Value Per Share | 1,654.73 |
Benefits of Choosing PNC Infratech Limited (PNCINFRANS)
- Comprehensive Financial Model: Leverage detailed data from PNC Infratech Limited for accurate DCF valuation.
- Complete Forecasting Control: Modify revenue growth, profit margins, WACC, and other essential variables.
- Real-Time Calculations: Automatic updates provide immediate insights as you make adjustments.
- Professional-Grade Template: A polished Excel format tailored for top-level valuation.
- Flexible and Reusable: Designed for adaptability, allowing repeated application for in-depth forecasts.
Key Features
- Customizable Forecast Inputs: Adjust essential factors such as revenue growth, EBITDA percentages, and capital expenditure estimates.
- Instant DCF Valuation: Provides quick calculations for intrinsic value, NPV, and other key financial metrics.
- High-Precision Accuracy: Leverages PNC Infratech Limited's (PNCINFRANS) actual financial data for more realistic valuation results.
- Effortless Scenario Analysis: Easily explore various assumptions and assess their impacts on outcomes.
- Efficiency-Boosting Solution: Streamlines the valuation process, eliminating the need for complex model construction from the ground up.
How It Functions
- Step 1: Download the Excel spreadsheet.
- Step 2: Examine PNC Infratech Limited’s pre-filled financial data and projections.
- Step 3: Adjust key variables such as revenue growth, WACC, and tax rates (highlighted cells).
- Step 4: Observe the DCF model refresh in real-time as you modify your assumptions.
- Step 5: Evaluate the results and leverage the findings for your investment strategies.
Why Opt for This Calculator?
- All-in-One Solution: Integrates DCF, WACC, and financial ratio analyses seamlessly.
- Flexible Parameters: Modify the yellow-highlighted cells to explore different scenarios.
- In-depth Analysis: Automatically computes PNC Infratech Limited’s intrinsic value and Net Present Value.
- Ready-to-Use Data: Historical and projected data provide reliable starting points.
- High-Quality Standards: Perfect for financial analysts, investors, and business advisors.
Who Can Benefit from This Product?
- Institutional Investors: Create comprehensive and trustworthy valuation models for PNC Infratech Limited's portfolio analysis.
- Corporate Finance Departments: Evaluate valuation scenarios to shape strategic decisions within the organization.
- Consultants and Financial Advisors: Deliver precise valuation assessments for PNC Infratech Limited (PNCINFRANS) to clients.
- Students and Academic Professionals: Utilize real-world data to learn and teach financial modeling techniques.
- Infrastructure Sector Enthusiasts: Gain insights into how companies like PNC Infratech Limited are valued in the industry.
Overview of the Template Contents
- Pre-Filled DCF Model: PNC Infratech Limited's financial data preloaded for immediate application.
- WACC Calculator: Comprehensive calculations for Weighted Average Cost of Capital.
- Financial Ratios: Analyze PNCINFRANS's profitability, leverage, and operational efficiency.
- Editable Inputs: Modify assumptions such as growth rates, margins, and capital expenditures to suit your scenarios.
- Financial Statements: Access annual and quarterly reports for a thorough analysis.
- Interactive Dashboard: Conveniently visualize essential valuation metrics and outcomes.
Disclaimer
All information, articles, and product details provided on this website are for general informational and educational purposes only. We do not claim any ownership over, nor do we intend to infringe upon, any trademarks, copyrights, logos, brand names, or other intellectual property mentioned or depicted on this site. Such intellectual property remains the property of its respective owners, and any references here are made solely for identification or informational purposes, without implying any affiliation, endorsement, or partnership.
We make no representations or warranties, express or implied, regarding the accuracy, completeness, or suitability of any content or products presented. Nothing on this website should be construed as legal, tax, investment, financial, medical, or other professional advice. In addition, no part of this site—including articles or product references—constitutes a solicitation, recommendation, endorsement, advertisement, or offer to buy or sell any securities, franchises, or other financial instruments, particularly in jurisdictions where such activity would be unlawful.
All content is of a general nature and may not address the specific circumstances of any individual or entity. It is not a substitute for professional advice or services. Any actions you take based on the information provided here are strictly at your own risk. You accept full responsibility for any decisions or outcomes arising from your use of this website and agree to release us from any liability in connection with your use of, or reliance upon, the content or products found herein.