
|
Pennantpark Investment Corporation (PNNT) DCF -Bewertung |
Fully Editable: Tailor To Your Needs In Excel Or Sheets
Professional Design: Trusted, Industry-Standard Templates
Investor-Approved Valuation Models
MAC/PC Compatible, Fully Unlocked
No Expertise Is Needed; Easy To Follow
PennantPark Investment Corporation (PNNT) Bundle
Unser DCF-Taschenrechner von Pennantpark Investment Corporation (PNNT) für Genauigkeit entwickelt, ermächtigt Sie die Bewertung der Pennantpark Investment Corporation mit realen Finanzdaten und bietet vollständige Flexibilität, um alle wesentlichen Parameter für erweiterte Projektionen zu ändern.
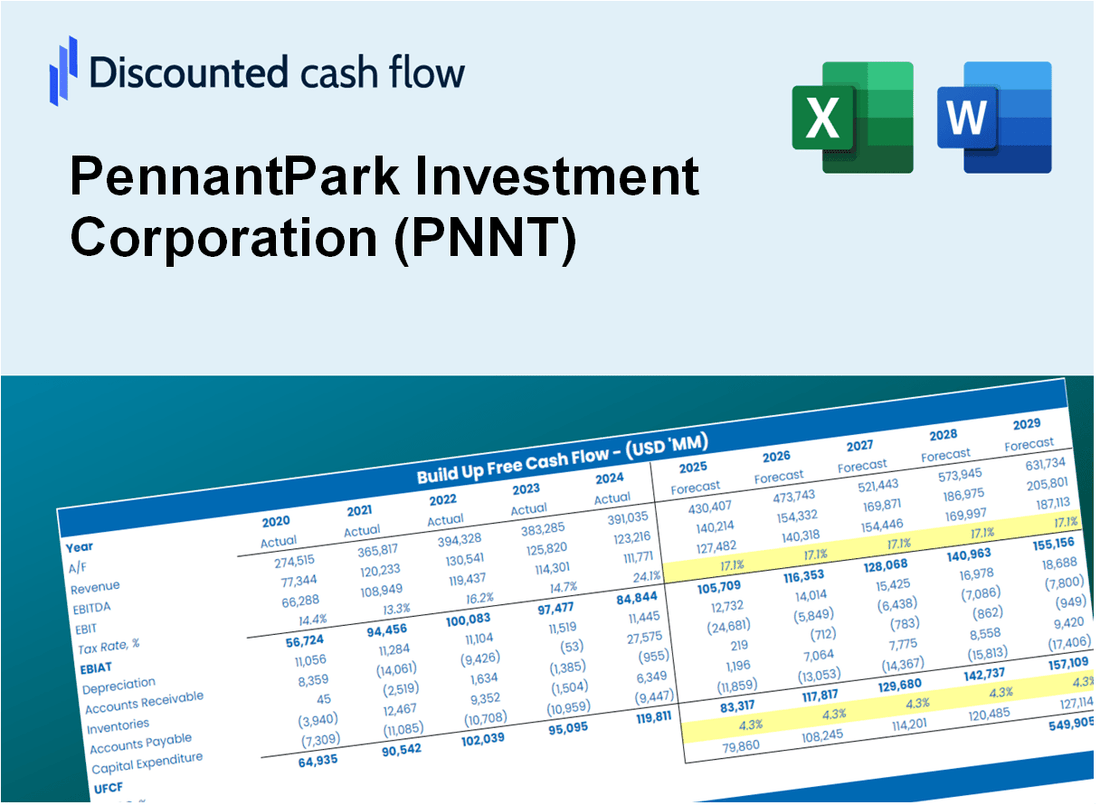
Discounted Cash Flow (DCF) - (USD MM)
| Year | AY1 2020 |
AY2 2021 |
AY3 2022 |
AY4 2023 |
AY5 2024 |
FY1 2025 |
FY2 2026 |
FY3 2027 |
FY4 2028 |
FY5 2029 |
|---|---|---|---|---|---|---|---|---|---|---|
| Revenue | 100.2 | 171.3 | 142.6 | 145.4 | 110.2 | 119.0 | 128.4 | 138.7 | 149.7 | 161.7 |
| Revenue Growth, % | 0 | 70.93 | -16.73 | 1.91 | -24.21 | 7.97 | 7.97 | 7.97 | 7.97 | 7.97 |
| EBITDA | 152.9 | -18.5 | -16.9 | .0 | 51.9 | 29.6 | 32.0 | 34.5 | 37.3 | 40.3 |
| EBITDA, % | 152.6 | -10.82 | -11.82 | 0 | 47.15 | 24.9 | 24.9 | 24.9 | 24.9 | 24.9 |
| Depreciation | 59.8 | -78.1 | -78.6 | -109.2 | -107.9 | -50.9 | -55.0 | -59.4 | -64.1 | -69.2 |
| Depreciation, % | 59.68 | -45.6 | -55.1 | -75.15 | -97.9 | -42.81 | -42.81 | -42.81 | -42.81 | -42.81 |
| EBIT | 93.1 | 59.6 | 61.7 | 109.2 | 159.8 | 82.3 | 88.9 | 96.0 | 103.7 | 111.9 |
| EBIT, % | 92.92 | 34.78 | 43.27 | 75.15 | 145.05 | 69.22 | 69.22 | 69.22 | 69.22 | 69.22 |
| Total Cash | 25.8 | 20.4 | 54.8 | 38.8 | 49.9 | 35.2 | 38.0 | 41.0 | 44.3 | 47.8 |
| Total Cash, percent | .0 | .0 | .0 | .0 | .0 | .0 | .0 | .0 | .0 | .0 |
| Account Receivables | 6.4 | 19.4 | 35.5 | 11.9 | 10.9 | 14.4 | 15.6 | 16.8 | 18.2 | 19.6 |
| Account Receivables, % | 6.39 | 11.35 | 24.89 | 8.19 | 9.9 | 12.14 | 12.14 | 12.14 | 12.14 | 12.14 |
| Inventories | .0 | .0 | .0 | -5.1 | .0 | -.8 | -.9 | -1.0 | -1.0 | -1.1 |
| Inventories, % | 0 | 0 | 0 | -3.49 | 0 | -0.69879 | -0.69879 | -0.69879 | -0.69879 | -0.69879 |
| Accounts Payable | 15.5 | 21.4 | 6.6 | 95.4 | 115.8 | 47.2 | 50.9 | 55.0 | 59.4 | 64.1 |
| Accounts Payable, % | 15.49 | 12.49 | 4.65 | 65.61 | 105.09 | 39.65 | 39.65 | 39.65 | 39.65 | 39.65 |
| Capital Expenditure | .0 | .0 | .0 | .0 | .0 | .0 | .0 | .0 | .0 | .0 |
| Capital Expenditure, % | 0 | 0 | 0 | 0 | 0 | 0 | 0 | 0 | 0 | 0 |
| Tax Rate, % | 5.06 | 5.06 | 5.06 | 5.06 | 5.06 | 5.06 | 5.06 | 5.06 | 5.06 | 5.06 |
| EBITAT | 100.7 | 59.4 | 63.8 | 141.3 | 151.7 | 81.5 | 87.9 | 95.0 | 102.5 | 110.7 |
| Depreciation | ||||||||||
| Changes in Account Receivables | ||||||||||
| Changes in Inventories | ||||||||||
| Changes in Accounts Payable | ||||||||||
| Capital Expenditure | ||||||||||
| UFCF | 169.6 | -25.9 | -45.6 | 149.5 | 60.2 | -40.8 | 35.6 | 38.5 | 41.5 | 44.9 |
| WACC, % | 6.16 | 6.14 | 6.16 | 6.16 | 5.97 | 6.12 | 6.12 | 6.12 | 6.12 | 6.12 |
| PV UFCF | ||||||||||
| SUM PV UFCF | 91.5 | |||||||||
| Long Term Growth Rate, % | 2.00 | |||||||||
| Free cash flow (T + 1) | 46 | |||||||||
| Terminal Value | 1,112 | |||||||||
| Present Terminal Value | 826 | |||||||||
| Enterprise Value | 918 | |||||||||
| Net Debt | 722 | |||||||||
| Equity Value | 196 | |||||||||
| Diluted Shares Outstanding, MM | 65 | |||||||||
| Equity Value Per Share | 3.00 |
What You Will Get
- Authentic PennantPark Data: Preloaded financials – from revenue to net income – based on actual and projected figures.
- Complete Customization: Modify all essential parameters (yellow cells) such as WACC, growth %, and tax rates.
- Instant Valuation Updates: Automatic recalculations to assess the effects of changes on PennantPark’s fair value.
- Flexible Excel Template: Designed for quick modifications, scenario analysis, and comprehensive projections.
- Efficient and Precise: Eliminate the need to build models from scratch while ensuring accuracy and adaptability.
Key Features
- Comprehensive Financial Data: Access reliable historical records and future forecasts for PennantPark Investment Corporation (PNNT).
- Adjustable Forecast Parameters: Modify highlighted fields such as WACC, growth rates, and profit margins.
- Real-Time Calculations: Instant updates to DCF, Net Present Value (NPV), and cash flow assessments.
- User-Friendly Dashboard: Intuitive charts and summaries for clear visualization of your valuation outcomes.
- Designed for All Skill Levels: An accessible layout tailored for investors, CFOs, and financial consultants.
How It Works
- Step 1: Download the prebuilt Excel template featuring PennantPark Investment Corporation’s (PNNT) data.
- Step 2: Navigate through the pre-filled sheets to familiarize yourself with the essential metrics.
- Step 3: Adjust forecasts and assumptions in the editable yellow cells (WACC, growth, margins).
- Step 4: Instantly see the recalculated results, including the intrinsic value of PennantPark Investment Corporation (PNNT).
- Step 5: Use the outputs to make informed investment decisions or create comprehensive reports.
Why Choose the PennantPark Investment Corporation (PNNT) Calculator?
- Accuracy: Utilizes real PennantPark financials to ensure precise data.
- Flexibility: Crafted for users to easily test and adjust inputs as needed.
- Time-Saving: Avoid the complexities of constructing a DCF model from the ground up.
- Professional-Grade: Designed with CFO-level accuracy and ease of use in mind.
- User-Friendly: Intuitive interface suitable for users without extensive financial modeling skills.
Who Should Use This Product?
- Individual Investors: Make informed decisions about buying or selling PennantPark Investment Corporation (PNNT) stock.
- Financial Analysts: Streamline valuation processes with ready-to-use financial models for PennantPark Investment Corporation (PNNT).
- Consultants: Deliver professional valuation insights on PennantPark Investment Corporation (PNNT) to clients quickly and accurately.
- Business Owners: Understand how companies like PennantPark Investment Corporation (PNNT) are valued to guide your own investment strategy.
- Finance Students: Learn valuation techniques using real-world data and scenarios related to PennantPark Investment Corporation (PNNT).
What the Template Contains
- Preloaded PNNT Data: Historical and projected financial data, including revenue, EBIT, and capital expenditures.
- DCF and WACC Models: Professional-grade sheets for calculating intrinsic value and Weighted Average Cost of Capital.
- Editable Inputs: Yellow-highlighted cells for adjusting revenue growth, tax rates, and discount rates.
- Financial Statements: Comprehensive annual and quarterly financials for deeper analysis.
- Key Ratios: Profitability, leverage, and efficiency ratios to evaluate performance.
- Dashboard and Charts: Visual summaries of valuation outcomes and assumptions.
Disclaimer
All information, articles, and product details provided on this website are for general informational and educational purposes only. We do not claim any ownership over, nor do we intend to infringe upon, any trademarks, copyrights, logos, brand names, or other intellectual property mentioned or depicted on this site. Such intellectual property remains the property of its respective owners, and any references here are made solely for identification or informational purposes, without implying any affiliation, endorsement, or partnership.
We make no representations or warranties, express or implied, regarding the accuracy, completeness, or suitability of any content or products presented. Nothing on this website should be construed as legal, tax, investment, financial, medical, or other professional advice. In addition, no part of this site—including articles or product references—constitutes a solicitation, recommendation, endorsement, advertisement, or offer to buy or sell any securities, franchises, or other financial instruments, particularly in jurisdictions where such activity would be unlawful.
All content is of a general nature and may not address the specific circumstances of any individual or entity. It is not a substitute for professional advice or services. Any actions you take based on the information provided here are strictly at your own risk. You accept full responsibility for any decisions or outcomes arising from your use of this website and agree to release us from any liability in connection with your use of, or reliance upon, the content or products found herein.